
Page 56 - 2018_09-Mondo
P. 56
A. McCabe et al.
Mfs, we observed a reduction in inducible nitric oxide syn- thesis (Nos2) expression, whereas induction of arginase 1 was seen in CD11blo/- Mfs (Online Supplementary Figure S6C). Elevated Nos2 expression and increased nitric oxide concentrations are associated with disease in SAA patients,29 thus IFNγ signaling in Mfs may drive patholog- ical M1 polarization in SAA.
Mf depletion increases functional platelet-biased HSCs To examine Mf-dependent regulation of HSC function and lineage bias in SAA, we transplanted HSCs sorted from the BM of PBS- or clod-lip-treated SAA mice 8 d.p.s.t. (Figure 5A). To our knowledge, HSC function and lineage bias have not previously been assayed in models of SAA, likely due to the severity of BM hypocellularity. HSCs exposed to Mfs during SAA showed little repopu- lating activity, indicating that exposure to secondary stress severely compromised their function, whereas HSCs from clod-lip-treated SAA mice exhibited platelet-, myeloid-, and lymphoid-repopulating capacity (Figure 5B). Thus our data demonstrate that in SAA, Mfs reduce HSC function
and impair platelet output.
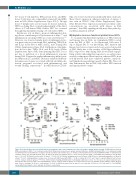
Figure 4. Clodronate-liposomes specifically deplete macrophages and rescue hematopoietic stem cell numbers during aplastic anemia. (A) Myeloid bone marrow (BM) cell numbers in PBS- (○) or clodronate-loaded (Clod; ●) liposome-treated severe aplastic anemia (SAA) mice. (B) BM cellularity in PBS- (○) or clodronate-loaded (Clod; ●) liposome-treated SAA mice on days 8 and 15 post-splenocyte transfer (p.s.t.) is shown. (C) Hematoxylin and eosin-stained BM from PBS- or clod-lip-treated radiation control (top) and SAA (bottom) mice 15 days post splenocyte transfer (d.p.s.t.). Scale bar=50 μm. (D) CD41lo/int and CD41hi HSC numbers 8 and 15 days d.p.s.t. *P<0.05. (E) Platelets in the blood 15 d.p.s.t. ***P<0.001. (F) GP1bβ+ megakaryocytes per 100mm2 of BM 15 d.p.s.t. Mean±Standard Error of Mean is shown. *P<0.05. (G) Kaplan-Meier survival curve for mice with SAA treated with PBS- (○; n=8) or clod-lip (●; n=9) 1 and 7 d.p.s.t. Log-rank (Mantel-Cox) test was used to compare between groups. **P<0.01. (H) Schematic showing administration of anti-Gp1bβ antibodies to mice 5 or 10 d.p.s.t. (I) Labeled platelets were measured in the blood over time. Two-way ANOVA was used to compare between groups. P<0.0001 and P=0.0007 for SAA-PBS versus radiation control (Rad) at days 5-9 p.s.t. and days 10-12 p.s.t., respectively; P<0.0001 for SAA-Clod versus Rad at days 5-9 p.s.t. and days 10-12 p.s.t.; P=0.004 and P=0.7 for SAA-PBS versus SAA-Clod at days 5-9 p.s.t. and days 10-12 p.s.t., respectively.
bet+ donor T-cell numbers, IFNγ protein levels, and IFNγ+ donor T cells were also comparable between LC and MIIG mice in SAA (Online Supplementary Figure S5F-J). Though donor T lymphocytes are necessary for disease initiation, HSC loss during SAA occurred independently of the direct effects of T-cell-derived IFNγ. Rather, HSC loss occurred through Mf-dependent sensing of T-cell-derived IFNγ.
Interferon-γ acts on Mfs to promote inflammation dur- ing disease contributing to M1 polarization of Mfs,24,25 and inflammation can impact HSC pool size and function.26,27 However, we observed similar levels of inflammatory fac- tors previously associated with SAA, including TNFa, IL-6, and IL-1β, in the BM of MIIG and LC mice during SAA (Online Supplementary Figure S6A). Furthermore, Mf deple- tion did not alter TNFa, IL-6, and IL-1β levels (Online Supplementary Figure S6B), demonstrating that HSC loss is not due to induction of a broad inflammatory response during SAA. Despite the similar inflammatory milieu, puri- fied Mfs from LC and MIIG SAA mice exhibited differen- tial expression of genes associated with M1 and M2 polar- ization, programs associated with inflammatory and wound healing, respectively.28 In MIIG-derived CD11b+
ABC
DEF
GHI
1456
haematologica | 2018; 103(9)
