
Page 94 - Haematologica July
P. 94
1172
Y. Heshmati et al.
ABC
DE
FGH
IJK
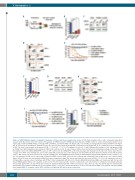
Figure 2. CHD4 inhibition impairs cell growth of leukemic cell lines and disease progression in vivo. A. Schematic drawing of the in vitro cell growth competition assay. B and F. Bar charts represent real time PCR analysis of mRNA levels after shRNA-based knockdown of CHD4, relative to control cells transduced with vectors expressing scrambled shRNA in MLL-rearranged THP-1, NOMO-1, and murine AML cells (Figure 2B), or in non-MLL rearranged HL-60, K-562 and NB-4 cells (Figure 2F), at 72 hours post transduction. Transduced cells were used for flow cytometry and growth competition assays (Figure 2D, E, H, I). mRNA levels were normalized to UBC. The data is represented as the mean ±S.E.M., ***P<0.005, ****P<0.001 (unpaired t-test), n=3. C and G. Western blot analyses of the endogenous CHD4 and Actin levels with and without knockdown of CHD4 in the indicated cells. D and H. Representative flow cytometry plots showing percentage of live RFP+ CHD4 knockdown cells in red (CHD4 shRNA-RFP) relative to GFP+ control cells (Sc shRNA-GFP), at the indicated days after transduction. E and I. Line charts depict the per- centage of live RFP+ cells normalized to 100% at the initial time point (Day one) of the indicated cells determined by flow cytometry analysis at the indicated time points. J. Bar charts represent real time PCR analysis of mRNA levels after shRNA-based knockdown of Chd4 using two independent lentiviral vectors, relative to con- trol cells transduced with vectors expressing scrambled shRNA in mouse AML cells that were subsequently transplanted into recipient mice for survival studies (Figure 2K) at 72 hours post transduction. mRNA levels were normalized to Hprt. The data is represented as the mean ±S.E.M., ****P<0.001 (unpaired t-test), n=3. K. Kaplan-Meier survival curves of wild-type (wt) C57BL/6 mice transplanted with 200,000 of murine MLL-AF9 transformed AML cells transduced with the two indi- vidual shRNA against CHD4, or the negative control vector. Percent survival and the number of animals for each cohort (time to euthanasia of moribund animals), were plotted against time, in days. Mean time survival of animals transplanted with control vector was 20 days, whereas it was 32 and 43 days for animals trans- planted with cells transduced with the two vectors against CHD4 (***P<0.005). Seven animals were used for each experiment. AML: acute myeloid leukemia; shRNA: short hairpin RNA; Sc: scramble control; RFP: red fluorescent protein; GFP: green fluorescent protein.
haematologica | 2018; 103(7)
