
Page 93 - Haematologica July
P. 93
range of functions and protein classes in different com- partments of the cells (Online Supplementary Figure S1). Genetic alterations of the 34 target genes occurred fre- quently in various cancers (Online Supplementary Figure S2). In addition, TMPRSS3 (amplifications), ZFHX3 (dele- tions), P4HA2 (deletions) and SMC1A (missense muta- tions and amplifications) were found in more than 2% of AML patient samples.34 Remarkably, mRNA expression
was significantly correlated with the decreased overall survival of AML for eight of the 34 target genes.35 Moreover, 17 of the target genes were found to be markedly transcriptionally upregulated in MLL- rearranged AML patient samples compared to healthy hematopoietic stem and progenitor cells (HSPCs).36 Thus, the data suggest that the screens were valid for identifica- tion of novel target genes in MLL-AF9 rearranged AML.
CHD4 is required for maintenance of childhood acute myeloid leukemia
A
BCD
EF
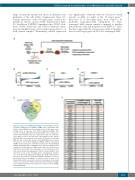
Figure 1. Large-scale shRNA-based RNAi screens identify novel tar- get genes required for cell growth of AML cells. A. Schematic illus- tration of the shRNA-based screening procedure. B. Bar chart repre- senting ratios of barcodes from 27104 individual shRNAs after screens in murine MLL-AF9 transformed AML cells compared to murine FDCP-mix BMs, after 10 cell divisions (T10). The 1086 bar- codes with at least a five-fold lower representation in the murine MLL-AF9 AML cells compared to the murine FDCP-mix cells are high- lighted in red. C and D. Bar charts representing differences in ratios of barcodes from 27491 individual shRNAs (THP-1) and 27104 (NOMO-1) after pooled loss of function screens after T10. Individual shRNAs targeting CHD4 are highlighted in red. E. Venn diagram illus- trating the overlap between target genes that are five-fold more depleted in mouse AML cells compared to mouse FDCP-mix control cells, five-fold depleted target genes in THP-1 cells and NOMO-1 cells after T10. F. List of the 34 target genes overlapping in all three screens in the Venn diagram from Figure 1E together with informa- tion about the number of individual shRNAs resulting in at least a five-fold reduction in abundance of barcodes in the screens of the human AML and the mean fold reduction in abundance of barcodes in the screens after T10. FDCP: factor dependent cell-Paterson; AML: acute myeloid leukemia; PCR: polymerase chain reaction; shRNA: short hairpin RNA.
haematologica | 2018; 103(7)
1171
