
Page 96 - Haematologica July
P. 96
Y. Heshmati et al.
assay described in Figure 2A, dynamic flow cytometric analysis displayed minor differences in cell growth between the control cells and the Chd4 depleted cells (Figure 3B,C). Similarly, CHD4 suppressed CD34 posi- tive umbilical cord blood cells (UCBs) (Figure 3D), showed a modest reduction in the number of viable cells compared to control cells, after 14 days of culturing
(Figure 3E), and as compared to the reduction in cell growth of CHD4 targeted AML cells (Figure 2; Online Supplementary Figure S3). Together, these results show that CHD4 is critical for cell growth of various types of leukemic cells and AML progression in vivo, but not for the proliferation and survival of normal primary hematopoietic cells.
A
BCD
EFG
HI
1174
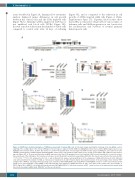
Figure 4. CRISPR-Cas9 mediated disruption of CHD4 prevents growth of human AML cells. A. Schematic image depicting the homology of the two gRNAs used for targeting of the coding region of the human CHD4 gene. The protospacer adjacent motifs (PAM) are highlighted in blue letters and the gRNA target sequences are highlighted in bold black letters. B and F. Bar charts of real time PCR quantification of isolated genomic DNA from the targeted CHD4 gene and control locus after CRISPR-Cas9 disruption of CHD4 using two individual gRNAs, relative to the cells transduced with control vectors, in THP-1 Cas9 (Figure 4B) or MV4-11 Cas9 express- ing cells (Figure 4F), at 72 hours post induction of gRNA expression. Real time PCR quantification of Cas9 targeted CHD4 loci was normalized to a control locus posi- tioned upstream of the CHD4 gene. The transduced cells were used in the growth competition assays (Figure 4D,E,H,I). The data is represented as the mean ±S.E.M., ***P<0.005, ****P<0.001 (unpaired t-test), n=3. C and G. Western blot analyses and quantification of the endogenous CHD4 and Actin levels in the indicated cells, with and without knockdown of CHD4, at 72 hours post transduction. D and H. Representative flow cytometry charts of the percentage of live mCherry+ THP- 1 (Figure 4D) or MV4-11 cells (Figure 4H) expressing Cas9, transduced with CHD4 gRNAs expressing iRF670 (CHD4-gRNA), relative to control cells transduced with empty vectors expressing BFP (control gRNA), at the indicated days after induction of gRNA expression. E and I. Line charts of the relative ratio, in percentage, of THP-1 (Figure 4E) or MV4-11 cells (Figure 4I) transduced with CHD4 gRNA-iRFP670+ knockout constructs or BFP+ control vectors, at the indicated time points using flow cytometry analysis. gRNA: guide RNA; RFP: red fluorescent protein.
haematologica | 2018; 103(7)
