
Page 55 - Haematologica July
P. 55
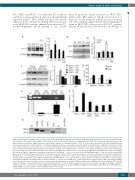
tion of PKCε and PKCd,50 it is likely that ET receptors A
(Nav1.8) promoter region increased in HbSS DRG.
haematologica | 2018; 103(7)
Mouse model of sickle cell disease
contribute to increased Nav1.8 expression through NF-κB
activation in HbSS DRG. NF-κB activation was indeed
enhanced in ET-1-stimulated cultured DRG neurons and
in vivo HbSS DRG, and this enhanced activation was ET
receptor-dependent. NF-κB binding to the Scn10a induced NF-κB activation. However, the involvement of
Figure 8. ET-1 induced activation of ETA receptors leads to the upregulation of Nav1.8 and activation of NF-κB in HbSS DRG neurons. (A) Cultured HbAA DRG neu- rons exposed to 400 nmol of ET-1 peptide for 24 hr displayed an increase in Nav1.8 protein. Co-administration of ABT-627 (1 mmol) prevented this increase. Left: Representative western blots. Right: Summary of densitometric analysis. n=3 biological repeats. **P<0.01 vs. the vehicle (Veh) group. (B) Cultured HbAA DRG neu- rons exposed to 400 nmol of ET-1 peptide for 90 minutes displayed an increase in phosphorylated p65 (p-p65). Co-administration of ABT-627 (1 mmol) 10 minutes prior to ET-1 stimulation prevented the increase in phosphorylated p65 protein. The amount of total p65 protein did not change among the treated groups. Left: Representative western blots. Right: Summary of densitometric analysis n=3 biological repeats. **P<0.01 vs. the vehicle (Veh) group. (C) The levels of phosphory- lated p65 (p-p65), increase in the L3-L4 DRG of the vehicle-treated HbSS mice. This increase is not seen in the ABT-627-treated HbSS mice. Left: representative Western blots. Right: a summary of densitometric analysis. n=3 mice/group. *P<0.01 vs. the vehicle-treated HbAA group, ##P<0.01 vs. the vehicle-treated HbSS group. (D) 45 mins after intraperitoneal injection of the NF-κB -specific inhibitor, PDTC, increased response to a low force (0.16 g) von Frey filament is alleviated in the HbSS mice. n = 6 mice/group. *P<0.05 vs. the baseline in HbAA mice. #P<0.05 vs. the baseline in HbSS mice. (E) Scn10a promoter fragments immunoprecip- itated by rabbit anti-p65 in the L3-L5 DRG from HbSS (SS) and HbAA (AA) mice. Top: representative gel image. Bottom: a summary of densitometric analysis. Input: total purified fragments. M: ladder marker. n=3 mice/genotype. **P<0.01 vs. the HbAA mice. (F) Scn10a promoter activity in mouse CAD cells transfected with a luciferase reporter vector containing a Scn10a promoter and treated with drugs as indicated. PMA: the PKC activator. BIM: the PKC-specific inhibitor. PDTC: the NF- κB-specific inhibitor. n=3 repeats/treatment. One-way ANOVA on Ranks, **P<0.01 vs. the vehicle group. #P<0.05 vs. the PMA-treated group. (G) Single cell RT-PCR analysis shows the co-expression of Scn10a mRNA, Ednra mRNA (encoding ET-1), and Rela mRNA (encoding p65) in individual small DRG neurons from HbAA mice. Gapdh mRNA is used as a positive control. M: ladder marker. n=3 repeats.
Additionally, PKC-induced NF-κB activation led to
increased Scn10a promoter activity in mouse neuronal
cells. These findings suggest that the Nav1.8 upregulation
found in HbSS DRG is the result of ET-1/ET receptor- AA
AB
C
EF
G
D
1133
