
Page 54 - Haematologica July
P. 54
1132
B.M. Lutz et al.
phosphorylation may not be a significant contributor to Nav1.8-mediated neuronal excitability and behavioral pain hypersensitivity. Additionally, we observed that the resting membrane potential of HbSS DRG neurons was elevated. This suggests a possible decrease in potassium channel expression or function. ET-1 has been shown to depress delayed rectifier potassium currents in rat DRG neurons.46 This depression of potassium currents may be involved in increased excitability of SCD neurons and the pain hypersensitivity of SCD mice found in this study. Thus, it is of interest to further examine whether the expression of other ion channels including delayed rectifi-
er potassium channels differs between HbAA and HbSS DRG neurons and whether these differences are ETA receptor-dependent.
NF-κB may be a key modulator of ET
receptor-depen- dent Nav1.8 upregulation in HbSS DRG. NF-κB is expressed in small and medium neurons of the DRG.47 Under inflammatory conditions, PKCε activation has been linked to Nav1.8 upregulation in DRG neurons48 and NF-κB activation.49 A recent study also reported that chemokine ligand 2 can induce NF-κB activation via PKC and lead to Nav1.8 upregulation in DRG neurons.30 Since ETA receptor activation leads to the downstream activa-
A
A
B
C
D
E
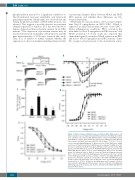
Figure 7. Nav1.8 channel activity increases in Townes HbSS DRG neurons. (A) Representative traces of Nav1.8 in small DRG neurons from the HbAA mice, HbSS mice, and these mice injected with ABT-627. (B) I-V curves in small DRG neurons from HbAA mice (24 neurons), HbSS mice (21 neurons), HbAA mice given ABT-627 (21 neurons), and HbSS mice given ABT-627 (23 neurons). *P<0.05, **P<0.01 vs. the corresponding HbAA group. (C) When tested at -15mV, HbSS mice exhibit an increase in Nav1.8 current in small DRG neurons compared to HbAA mice. This increase is abolished in HbSS mice given ABT-627. n=25 neurons for the HbAA group, 22 for the HbSS group, 21 for the HbAA with ABT-627 group, and 23 for the HbSS with ABT-627 group. *P<0.05 vs. the HbAA group. #P<0.05 vs. the HbSS group. (D) Activation curve for Nav1.8. Curves are fitted by Boltzmann function. E0.5 = -20.35 ± 1.16 mV for the HbAA group (n = 21 neurons), -24.79 ± 0.93 mV for the HbSS group (n=24 neurons), -21.34 ± 0.65 mV for the HbAA with ABT-627 group (n=21 neurons), and -24.37 ± 0.82 mV for the HbSS with ABT-627 group (n=23 neurons). (E) Inactivation curve for Nav1.8. Curves are fitted by Boltzmann function. E0.5 = -37.56 ± 1.32mV for the HbAA group (n=27 neurons), -45.80 ± 1.80 mV for the HbSS group (n=24 neurons), -39.79 ± 1.11 mV for the HbAA with ABT-627 group (n=19 neurons), and -41.05 ± 1.86 mV for the HbSS with ABT-627 group (n=24 neurons).
haematologica | 2018; 103(7)
