
Page 52 - Haematologica July
P. 52
B.M. Lutz et al.
PMA into the medium. PMA stimulation increased the activity of the Scn10a gene promoter by 3.5-fold as com- pared to the vehicle-treated group (Figure 8F). Co-admin- istration of PDTC or bisindolylmaleimide I (BIM), a PKC inhibitor, prevented this increase (Figure 8F). BIM or PDTC alone did not affect basal luciferase activity (Figure 8F). These results indicate that the increased Scn10a gene activity is a specific response to PKC/NF-κB activation. Single-cell RT-PCR analysis revealed that 40% of individ- ual small DRG neurons co-expressed Scn10a mRNA, Ednra mRNA, and Rela mRNA (encoding p65) (Figure 8G). Taken together, our findings suggest the participation of NF-κB in ETA receptor-dependent Nav1.8 upregulation in HbSS DRG neurons (Online Supplementary Figure S11).
Discussion
Pain is a major symptom reported by SCD patients. Currently, painkillers such as opioids are prescribed for SCD pain management but repeated and/or prolonged administration of these drugs has limited analgesic effica- cy and the potential to produce side effects.6 Identifying novel and specific targets for pain management is essential for improving SCD patient care. We showed here that the expression of ET-1 and its ETA receptor increases in the DRG of SCD mice. Sensory neuron-specific knockdown or local inhibition of DRG ETA receptors alleviated basal and post-hypoxia mechanical allodynia and thermal/cold hyperalgesia in SCD mice. Although the exact mechanism
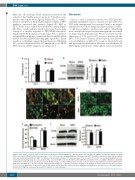
A
B
C
D
EF
1130
Figure 5. ET-1 and ETA receptor expression increases in the DRG of Townes HbSS mice. (A) Expression of Edn1 mRNA (encoding ET-1) and Ednra mRNA (encoding ETA receptor) in the L3-L4 DRG. n=3 mice/genotype. **P<0.01 vs. the corresponding HbAA mice. (B) Expression of ET-1 and ETA receptor proteins in the L3-L4 DRG. Left: representative Western blots. Right: a summary of densitometric analysis. n=3 mice/genotype. *P<0.05 and **P<0.01 vs. the corresponding HbAA mice. (C) Double immunostaining shows the co-localization of ETA receptors (ETAR) or pre-pro ET-1 (ET-1) with CGRP, IB4, and NF200 in the L3-L4 DRG of HbAA mice (for ETAR) or HbSS mice (for ET-1). Scale bar: 50 mm. (D and E) Number of ETA receptors (ETAR)-positive neurons or pre-pro ET-1 (ET-1)-positive neurons in the L4 DRG from HbAA mice and HbSS mice. D: representative immunostaining images. E: a summary of statistical analysis of the number of positive neurons. n=3 mice/genotype. **P<0.01 vs. the HbAA mice. Scale bar: 50 mm. (F) Expression of ET-1 and ETA receptor proteins in hind paw from HbAA mice and HbSS mice. Left: representative Western blots. Right: a summary of densitometric analysis. n=3 mice/genotype.
haematologica | 2018; 103(7)
