
Page 108 - Haematologica July
P. 108
1186
H. Horn et al.
AB
C
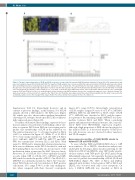
Figure 2. The gene expression profiles of FL3B and FL3A seem to be closely related. A supervised ANOVA analysis identified 13 probe IDs (=12 unique genes) that were most variable between FL1/2, FL3A and FL3B. The majority of FL3B samples more closely resembled the expression pattern of FL3A (A), which was also evident when performing hierarchical clustering based upon the expression of the 13 probe IDs. The legend indicates how many samples belong to an individual entity [eg. FL1(12) represents 12 FL1 samples] (B). Application of a linear classifier that separates FL1/2 from FL3A and subsequently predicts class membership of six FL3B cases revealed that the majority of these FL3B (4 of 6, 67%) show a “FL3A”-like Gene Expression Profile. This result further indicates that the close relationship between FL3A and FL3B is not due to a methodological artefact introduced by ANOVA analysis because the classification approach uses a distinct strategy. The dashed vertical line at Y intercept at 50% separates the ’FL1/2’-like and ’FL3A’-like Gene Expression Profiles. Each follicular lymphoma (FL) entity is represented by an individual symbol (circle: FL1; triangle FL3A; square FL3B). The vertical dotted lines separate the three FL entities (C).
Supplementary Table S3). Interestingly, however, and in contrast to previous findings,8 in this analysis, 5 of 6 FL3B samples showed a GEP similar to the FL3A cases (Figure 2A) which was also shown when applying hierarchical clustering to FL subtypes based upon the 12 most differen- tially expressed genes (Figure 2B).
To further substantiate these findings, supervised classi- fication analysis was performed establishing a linear clas- sifier to separate FL1/2 from FL3A in a test setting and to predict class membership of FL3B in the validation set. The relative frequency (as %) of being classified as FL1/2 (>50%) is indicated in Figure 2C. While 17 of 22 FL1/2 (77%) were clearly classified as such, the GEP of 5 FL1/2 (23%, MPI-629, MPI-772, MPI-776, MPI-777 and MPI- 889) was intermediate between FL1/2 and FL3A. With regard to FISH and/or immunohistochemical parameters, there was no difference in the FL1/2 classified as such and the 5 spiking FL1/2, most notably also not in respect of the proliferation index as measured by Ki67 (data not shown). Moreover, 13 of 16 FL3A (81%) were explicitly classified as such, while GEP of 2 FL3A (13%, MPI-632 and MPI- 643) tended towards the profile of FL1/2. One FL3A (6%, MPI-867) was distinctly classified as FL1/2. All 3 ‘misclas- sified’ FL3A harbored only low numbers of Ki67-positive cells (mean: 18%, range 5-30%) as the only striking fea- ture when compared with their ‘classical’ counterparts
(mean: 63%, range 30-90%). Interestingly, categorization of FL3B samples assigned 4 cases (4 of 6, 67%; MPI-660, MPI-661, MPI-721 and MPI-817) as FL3A, while 1 FL3B (17%, MPI-649) was classified as FL1/2, and the expres- sion pattern of the remaining sample (MPI-667) was inter- mediate between FL1/2 and FL3B. When considering genetic and immunohistochemical features, the 2 ‘misclas- sified’ FL3B were IRF4/MUM1 expression negative, although a high proportion of FL3B showed positivity for this marker (Table 1). A decreased number of Ki67-posi- tive cells, however, was not observed in these ‘misclassi- fied’ FL3B samples.
Gene expression profiles of FL3B/DLBCL cluster in between FL3B and GCB-DLBCL
To asses whether FL3B and DLBCL/FL3B show a GEP more similar to FL or DLBCL, classification analysis was undertaken by devising a linear classifier allowing for the distinction of FL1/2 and DLBCL, since GEP clearly separat- ed these entities, with 7059 probe IDs (5027 genes) being differentially expressed. Subsequently, the linear classifier was used to predict class-membership of FL3A, FL3B and FL3B/DLBCL (Figure 3A). GEPs of FL1/2 and DLBCL appeared quite distinct. A homogenous GEP of FL1/2 and DLBCL was observed with only a few exceptions. Of note, 1 DLBCL (MPI-226) was classified as FL1/2 in
haematologica | 2018; 103(7)
