
Page 107 - Haematologica July
P. 107
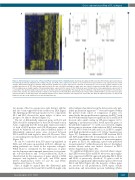
Figure 1. Differential gene expression of FL1/2 and FL3A is independent of t(14;18)-status. Heatmap visualizing all 747 probe IDs differentially expressed between the histological follicular lymphoma (FL) subtypes FL1/2 and FL3A. Gene expression is shown as a pseudocolored representation of log expression ratio (=fold change), with yellow being above and blue being below the median level of gene expression in each row, as shown by the color scale (A). A robust estimate of the median expression of all 747 differentially expressed probe IDs was calculated resulting in a single value per sample (=expression index). While the indices of the FL1/2 subgroup were mainly negative (=down-regulated gene expression), the values for the FL3A group were mostly positive (=up-regulated gene expression). In each boxplot, the diamond symbol represents the mean index value (B). Separating the FL1/2 group into its individual components revealed that the mean indices between FL1 and FL2 are almost identical to FL3A (C). The frequency of the t(14;18) is almost balanced in FL1/2 (75%) and FL3A (82%), and also the mean gene expression indices of t(14;18)-positive and t(14;18)-negative FL are almost identical. This supports the notion that the different expression profiles of FL1/2 and FL3A were not the result of differences in the t(14;18)-status (D).
Gene expression profiling of FL subtypes
ABC
D
two means of the two groups were quite distinct, and this had also been supported by the results from DEA (Figure 1B). Splitting up the FL1/2 group into its two components (FL1 and FL2) showed the mean indices of these two groups to be almost identical (Figure 1C).
The list of differentially expressed genes in FL1/2 and FL3A should be independent of the t(14;18)-translocation status, suggesting that the mean gene expression indices of both t(14;18)-positive and t(14;18)-negative samples, should be balanced. Of note, almost identical indices of differentially expressed genes were observed between FL1/2 and FL3A with regard to their t(14;18)-status. Thus, a confounding effect mediated by t(14;18) can be excluded (Figure 1D).
As can be concluded from 519 genes up-regulated in FL3A and 125 genes up-regulated in FL1/2, different sig- naling pathways are active in the respective subtypes. While FL1/2 is dominated by the expression of genes involved in microenvironmental interactions (as for exam- ple cell-cell-adhesion and T-cell proliferation), FL3A is characterized by the expression of genes related to RNA transport and regulation, cell cycle, and DNA repair (Online Supplementary Tables S1 and S2, and Online Supplementary Figures S3 and S4).
Since it might be argued that the differential gene expression observed between FL1/2 and FL3A might only
reflect enhanced proliferation in the latter, previously pub- lished proliferation signatures14,15 were investigated within the present study cohort. A comparison of genes con- tained in the known proliferation signature (n=592)14 with the 643 differentially expressed genes in FL1/2 and FL3A/B showed only a small overlap in 105 genes (approx. 16%). Applying a ‘proliferation index’ based upon the genes of the published signature14 to our FL cases revealed a highly heterogeneous spectrum of the indices in FL1/2, indicating 10 of 22 (45%) with low (≤0) and 12 of 22 (55%) samples with high proliferation index (>0) (Online Supplementary Figure S5). Furthermore, differential GEP between FL1/2 and FL3A might reflect the non-malignant stroma, as indi- cated also by enhanced expression of microenvironmen- tal genes in FL1/2. By analyzing a previously published stromal signature16 within the present data set, the highest median stroma index was indeed observed in FL1/2 (Online Supplementary Figure S6).
No significant differences were observed when compar- ing GEPs between FL3A and FL3B. Moreover, upon apply- ing a supervised ANOVA approach including FL1/2, FL3A and FL3B, as previously described,8 12 genes could be identified as significantly differentially expressed between FL1/2 and FL3A (Figure 2A); the majority of these genes are involved in cell proliferation, DNA repair, cellular metabolism and intracellular protein trafficking (Online
haematologica | 2018; 103(7)
1185
