
Page 106 - Haematologica July
P. 106
H. Horn et al.
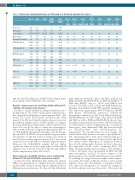
Table 1. Clinical data, immunohistochemistry and FISH analysis of all folicular lymphoma (FL) subsets.
FL1/2 FL3A FL3B FL3B/ GCB- DLBCL DLBCL
N.ofcases 22 16 6 9 44 Medianage, 58 57 53 57 60 years (range) (38-78) (36-71) (39-66) (34-80) (8-85) Male/female 7/8 5/7 4/0 3/6 24/19 MedianOS,months 69 72 55 98 45
P
FL1/2 FL1/2 FL1/2 FL1/2 FL3A FL3B FL3B
vs. vs. vs. vs. vs. vs. vs.
FL3A FL3B DLBCL/FL3B DLBCL FL3B DLBCL/FL3B DLBCL
ns ns ns ns
ns ns
ns ns ns
ns ns ns ns ns ns ns ns ns
0.0007 0.00004 ns 0.023 0.029 ns ns ns ns ns 0.03 ns 0.014 0.0001 ns 0.00006 0.00003 ns
BCL2-Break (%) BCL6-Break (%) MYC-Break (%) CD10 (%) IRF4/MUM1 (%) Ki67 (%)
BCL2 (%) BCL6 (%)
18/22 12/16
(82) (75)
2/22 5/16
(9) (31)
1/22 1/16
(5) (6)
13/21 8/12
(62) (67)
0/16 4/8
(0) (50)
3/20 4/15
(15) (27)
15/20 12/15
(75) (80)
15/17 12/13
ns 13/43 ns
ns ns ns ns ns ns ns ns
ns ns ns ns ns ns ns ns ns ns ns ns ns ns
gene expression between: i) FL1/2 and FL3A; ii) FL3A and FL3B; iii) FL3B and DLBCL/FL3B; iv) FL3B and DLBCL; v) FL3A and DLBCL; and vi) FL1/2 and DLBCL was assessed. The GEPs of FL1/2, FL3A and FL3B differed sig- nificantly from DLBCL (with 7059 probeIDs mapping to 5027 annotated unique genes), 5093 (3798 genes) and 840 (691 genes) differentially expressed, respectively. Intriguingly, comparison of FL1/2 and FL3A revealed sig- nificant differences in GEPs (Figure 1A), while both FL3A and FL3B, as well as FL3B and DLBCL/FL3B, showed sim- ilar expression patterns (data not shown). DEA between FL1 versus FL2 failed to disclose significantly up- or down-reg- ulated genes. Since differential GEPs had been described for t(14;18)-positive and t(14;18)-negative FL, respectively,13 the t(14;18) status for each sample was included in the final model to account for potentially hid- den confounding effects. This ensures that the final list of genes differentially expressed between FL1/2 and FL3A does indeed reflect differences in regulation between these two FL entities and is therefore not due to the sam- ple's individual t(14;18) status. Comparing FL1/2 and FL3A, 643 differentially expressed genes were identified; of those, 519 genes were up-regulated in FL3A and 125 genes up-regulated in FL1/2. A robust estimate of the median expression of all 643 regulated genes was calculat- ed, resulting in a single value per sample, termed expres- sion index. The FL1/2 subgroup tended to have mainly negative values since the majority of regulated features were indeed down-regulated. In contrast, the samples in the FL3A subtype were mostly positive. Obviously, the
3/6 1/9
(50) (11) (30)
1/6 4/9
(17) (44) (34)
15/44 ns
1/6 2/9
(17) (22) (9)
4/44 ns
2/2 4/7
(100) (57) (33)
14/42 ns
2/3 2/6
(67) (33) (51)
3/5 7/8
(60) (88) (69)
20/39 0.0009 0.00005
29/42 ns 0.0359
2/4 5/7
(50) (71) (56)
3/3 5/7
24/43 ns ns ns ns ns 34/39 ns ns ns ns ns
(88) (92) (100) (71) (87)
1184
DLBCL: diffuse large B-cell lymphoma; OS: overall survival; N: number; ns: not significant.
and the other FL-subgroups, with FL3A showing features more similar to FL1/2 than the other subtypes.
Results of gene expression profiling within different FL subtypes by unsupervised analysis
In order to clarify whether FL subtypes defined by cyto- morphology do also harbor unique gene expression pro- files, hierarchical clustering was performed in 44 FL: FL1 (n=12), FL2 (n=10), FL3A (n=16) and FL3B (n=6). With regard to the 100 most variably expressed genes, however, the different samples did not cluster together according to their pre-defined histological grade (Online Supplementary Figure S2A and B). In order to clarify the relationship of tumors with a follicular background, particularly FL3B ver- sus GCB-DLBCL, hierarchical clustering of the 44 FL sam- ples and 45 GCB-DLBCL was performed using two differ- ent strategies. 1) The first round of analysis was based on the 100 most variably expressed genes, and 2) the second round focussed on the 500 most variably expressed genes. However, the GCB-DLBCL samples did not cluster together in either of the two approaches, and the 6 FL3B samples were scattered in between FL1-3A and DLBCL (Online Supplementary Figure S2C and D).
Gene expression profiling reveals a close relationship between FL3A and FL3B with supervised analysis
In the next step, differential gene expression analysis (DEA) was performed to compare the gene expression profiles (GEP) of tumor subtypes and to align the results to different molecular features. To this end, the differential
haematologica | 2018; 103(7)
