
Page 110 - Haematologica July
P. 110
1188
H. Horn et al.
A
BC
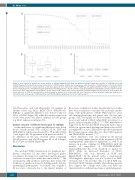
Figure 4. Gene expression profiles and overall survival of follicular lymphoma (FL) with and without t(14;18). Classification analysis of t(14;18)-positive and t(14;18)-negative FL revealed that the expression profile of t(14;18)-negative samples was homogeneous, while the profile of t(14;18)-positive FL fluctuates, with 6 t(14;18)-positive FL that were mainly classified as t(14;18)-negative (A). Gene expression of CD10 (=MME) was only significantly different when comparing the entire group of t(14;18)-positive and t(14;18)-negative lymphomas [including germinal center B-cell diffuse large B-cell lymphoma (GCB-DLBCL), first two boxplots from the left], but not when comparing FLs only (boxplots 3 and 4). Only a trend towards lowered CD10 expression in t(14;18)-negative FLs was observed. In the boxplot, the mean expression of CD10 is represented by a diamond symbol in addition to its median value (B). Gene expression of BCL2 showed no significant differences at all, neither in the entire group of t(14;18)-positive and t(14;18)-negative lymphomas, nor in the FL group only (C).
t(14;18)-positive and t(14;18)-negative FL samples in another cohort (e.g. BCL2, BCL6, CD10, IRF4/MUM1, IKBKE),13 a significant difference was detected only for CD10 (=MME) (Figure 4B), while the median expression of the other genes was almost identical in both groups (e.g. BCL2 expression in Figure 4C).
Clinical outcome of different histological FL subtypes
In this small series, no significant differences were noted in the overall survival (OS) of FL1/2, FL3A, FL3B and FL3B/DLBCL, which ranged from 55 to 98 months (Table 1 and Figure 5A). In agreement with previous studies,13,17 no difference in OS was observed when comparing t(14;18)-positive and t(14;18)-negative FL of all subtypes (FL1/2, FL3A and FL3B) (Figure 5B).
Discussion
The up-dated WHO classification for lymphoid neo- plasms categorizes FL into three histological grades according to the number of centroblasts and the presence or absence of centrocytes within the tumor follicles.1,18 The vast majority of FL are FL1/2, and hence have formed the backbone of a plethora of reports defining genetic features underlying FL pathogenesis.19 In contrast, data on grade 3 FL are scarce, obviously due to the limited number of
these cases available for studies. In particular, few studies have been conducted to elucidate the molecular mecha- nisms of the pathogenesis of FL3B. With respect to avail- able immunophenotypic and genetic data, the two sub- groups of FL3 are regarded as discrete entities, with FL3A more closely related to FL1/2, while FL3B, in contrast, to a greater extent resembles DLBCL.2,6,8,20,21 This hypothesis is supported by the fact that FL3A frequently harbor FL1/2 follicles in a given tumor specimen and harbor the t(14;18) in roughly 60% of cases, while FL3B only show infrequent BCL2 translocations, while they are often CD10 negative and IRF4/MUM1 positive.2,6,8,20,21
These differences were also evident in the present study, showing a linear decrease in the frequency of BCL2 rearrangements (although not significant), as well as an increase in positive stainings for IRF4/MUM1 with the number of centroblasts. A CD10+IRF4/MUM1– immunophenotype has been described as typical for FL1/2, while an increased frequency of CD10- IRF4/MUM1+ cells was reported in FL3B and DLBCL/FL3B.6,9 In the present study, a characteristic CD10-negative phenotype was not observed in FL3B, obviously due to the fact that only 2 of the 6 FL3B ana- lyzed had CD10 stainings available. Nevertheless, present data support the concept that FL3A and FL3B are characterized by a different spectrum of underlying genet-
haematologica | 2018; 103(7)
