
Page 246 - Haematologica Vol. 107 - September 2022
P. 246
LETTER TO THE EDITOR
and specificity, the negative and positive predictive values (NPV and PPV) of each model were determined as well as the odds ratio (OR). All calculations were performed using SPSS v.26.0 software (Released 2019) (IBM Corp., Armonk, NY, USA).
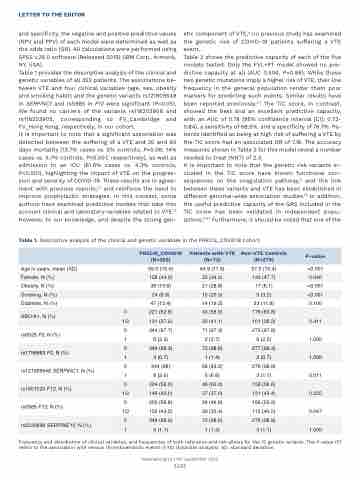
Table 1 provides the descriptive analysis of the clinical and genetic variables of all 352 patients. The associations be- tween VTE and four clinical variables (age, sex, obesity and smoking habit) and the genetic variants rs121909548 in SERPINC1 and rs5985 in F13 were significant (P<0.05). We found no carriers of the variants rs118203906 and rs118203905, corresponding to FV_Cambridge and FV_Hong Kong, respectively, in our cohort.
It is important to note that a significant association was detected between the suffering of a VTE and 30 and 90 days mortality (13.7% cases vs. 5% controls, P=0.06; 14% cases vs. 5.7% controls, P<0.001; respectively), as well as admission to an ICU (61.6% cases vs. 4.3% controls, P<0.001), highlighting the impact of VTE on the progres- sion and severity of COVID-19. These results are in agree- ment with previous reports,1,2 and reinforce the need to improve prophylactic strategies. In this context, some authors have examined predictive models that take into account clinical and laboratory variables related to VTE.12 However, to our knowledge, and despite the strong gen-
etic component of VTE,4 no previous study has examined the genetic risk of COVID-19 patients suffering a VTE event.
Table 2 shows the predictive capacity of each of the five models tested. Only the FVL+PT model showed no pre- dictive capacity at all (AUC 0.506, P=0.86). While these two genetic mutations imply a higher risk of VTE, their low frequency in the general population render them poor markers for predicting such events. Similar results have been reported previously.5,7 The TiC score, in contrast, showed the best and an excellent predictive capacity, with an AUC of 0.78 (95% confidence interval [CI]: 0.72- 0.84), a sensitivity of 68.5%, and a specificity of 76.7%. Pa- tients identified as being at high risk of suffering a VTE by the TiC score had an associated OR of 7.16. The accuracy measures shown in Table 2 for this model reveal a number needed to treat (NNT) of 2.3.
It is important to note that the genetic risk variants in- cluded in the TiC score have known functional con- sequences on the coagulation pathway,5 and the link between these variants and VTE has been established in different genome-wide association studies.13 In addition, the useful predictive capacity of the GRS included in the TiC score has been validated in independent popu- lations.5,6,7 Furthermore, it should be noted that one of the
Table 1. Descriptive analysis of the clinical and genetic variables in the PRECIS_COVID19 cohort.
PRECIS_COVID19 (N=352)
Patients with VTE (N=73)
Non-VTE Controls (N=279)
P-value
Age in years, mean (SD)
59.0 (15.0)
64.9 (11.5)
57.5 (15.4)
<0.001
Female, N (%)
158 (44.9)
25 (34.2)
133 (47.7)
0.040
Obesity, N (%)
38 (10.8)
21 (28.8)
17 (6.1)
<0.001
Smoking, N (%)
24 (6.8)
15 (20.5)
9 (3.2)
<0.001
Diabetes, N (%)
47 (13.4)
14 (19.2)
33 (11.8)
0.100
ABO:A1, N (%)
0
221 (62.8)
43 (58.9)
178 (63.8)
1/2
131 (37.2)
30 (41.1)
101 (36.2)
0.411
rs6025 F5, N (%)
0
344 (97.7)
71 (97.3)
273 (97.8)
1
8 (2.3)
2 (2.7)
6 (2.2)
1.000
rs1799963 F2, N (%)
0
349 (99.3)
72 (98.6)
277 (99.3)
1
3 (0.7)
1 (1.4)
2 (0.7)
1.000
rs121909548 SERPINC1, N (%)
0
344 (98)
68 (93.2)
276 (98.9)
1
8 (2.0)
5 (6.8)
3 (1.1)
0.011
rs1801020 F12, N (%)
0
204 (58.0)
46 (63.0)
158 (56.6)
1/2
148 (42.0)
27 (37.0)
121 (43.4)
0.325
rs5985 F13, N (%)
0
200 (56.8)
34 (46.6)
166 (59.5)
1/2
152 (43.2)
39 (53.4)
113 (40.5)
0.047
rs2232698 SERPINE10, N (%)
0
348 (98.9)
72 (98.6)
276 (98.9)
1
4 (1.1)
1 (1.4)
3 (1.1)
1.000
Frequency and distribution of clinical variables, and frequencies of both reference and risk alleles for the 12 genetic variants. The P-value (P) refers to the association with venous thromboembolic events (VTE) (bivariate analysis). SD: standard deviation.
Haematologica | 107 September 2022
2245
