
Page 247 - Haematologica Vol. 107 - September 2022
P. 247
LETTER TO THE EDITOR
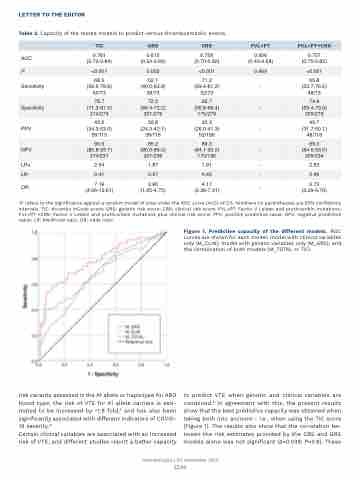
Table 2. Capacity of the tested models to predict venous thromboembolic events.
TiC
GRS
CRS
FVL+PT
FVL+PT+CRS
AUC
0.781 (0.72-0.84)
0.615 (0.54-0.69)
0.756 (0.70-0.82)
0.506 (0.43-0.58)
0.757 (0.70-0.82)
P
<0.001
0.002
<0.001
0.869
<0.001
Sensitivity
68.5 (56.6-78.9) 50/73
52.1 (40.0-63.9) 38/73
71.2 (59.4-81.2) 52/73
-
65.8 (53.7-76.5) 48/73
Specificity
76.7 (71.3-81.5) 214/279
72.0 (66.4-72.2) 201/279
62.7 (56.8-68.4) 175/279
-
74.9 (69.4-79.9) 209/279
PPV
43.5 (34.3-53.0) 50/115
32.8 (24.3-42.1) 38/116
33.3 (26.0-41.3) 52/156
-
40.7 (31.7-50.1) 48/118
NPV
90.3 (85.8-93.7) 214/237
85.2 (80.0-89.5) 201/236
89.3 (84.1-93.2) 175/196
-
89.3 (84.6-93.0) 209/234
LR+
2.94
1.87
1.91
-
2.63
LR-
0.41
0.67
0.46
-
0.46
OR
7.16 (4.06-12.61)
2.80 (1.65-4.75)
4.17 (2.38-7.31)
-
5.73 (3.29-9.79)
'P' refers to the significance against a random model of area under the ROC curve (AUC) of 0.5. Numbers (in parentheses) are 95% confidence intervals. TiC: thrombo inCode score; GRS: genetic risk score; CRS: clinical risk score; FVL+PT: Factor V Leiden and prothrombin mutations; FVL+PT +CRS: Factor V Leiden and prothrombin mutations plus clinical risk score; PPV: positive predictive value; NPV: negative predictive value; LR: likelihood ratio; OR: odds ratio.
risk variants assessed is the A1 allele or haplotype for ABO blood type; the risk of VTE for A1 allele carriers is esti- mated to be increased by ~1.8 fold,5 and has also been significantly associated with different indicators of COVID- 19 severity.14
Certain clinical variables are associated with an increased risk of VTE, and different studies report a better capacity
to predict VTE when genetic and clinical variables are combined.8 In agreement with this, the present results show that the best predictive capacity was obtained when taking both into account - i.e., when using the TiC score (Figure 1). The results also show that the correlation be- tween the risk estimates provided by the CRS and GRS models alone was not significant (b=0.039; P=0.6). These
Haematologica | 107 September 2022
2246
Figure 1. Predictive capacity of the different models. ROC curves are shown for each model: model with clinical variables only (M_CLIN); model with genetic variables only (M_GRS); and the combination of both models (M_TOTAL or TiC).
