
Page 168 - Haematologica Vol. 107 - September 2022
P. 168
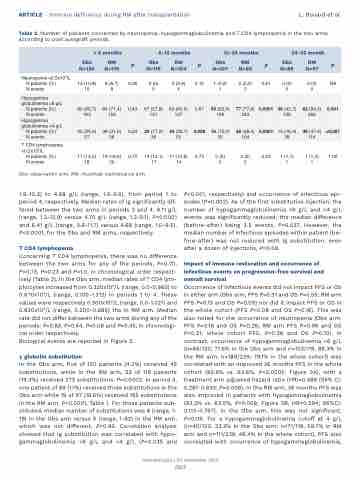
ARTICLE - Immune deficiency during RM after transplantation L. Bouard et al. Table 2. Number of patients concerned by neutropenia, hypogammaglobulinemia and T CD4 lymphopenia in the two arms
according to post autograft periods.
       < 6 months
 6-12 months
 12-24 months
 24-36 month
  Obs N=120
 RM N=119
 P
 Obs N=116
 RM N=104
 P
 Obs N=107
 RM N=99
 P
 Obs N=89
 RM N=97
 P
 Neutropenia <0,5x10⁹/L N patients (%)
N events
 13 (10,8) 15
 8 (6,7) 8
 0,26
 0 (0) 0
 3 (2,9) 4
 0,10
 1 (0,9) 1
 2 (2,0) 2
 0,61
 0 (0) 0
 0 (0) 0
 NA
 Hypogamma globulinemia <6 g/L
N patients (%)
N events Hypogamma globulinemia <4 g/L
N patients (%) N events
80 (66,7) 163
30 (25,0) 57
85 (71,4) 154
38 (31,9) 56
0,43
0,24
67 (57,8) 131
20 (17,2) 39
63 (60,6) 127
34 (32,7) 53
0,67
0,008
56 (52,3) 169
16 (15,0) 35
77 (77,8) 243
38 (38,4) 104
0,0001
0,0001
38 (42,7) 126
15 (16,9) 38
82 (84,5) 266
46 (47,4) 114
0.001
<0,001
 T CD4 lymphopenia <0,2x10⁹/L
N patients (%) N events
 17 (14,2) 18
 19 (16,0) 20
 0,70
 14 (12,1) 17
 11 (10,6) 14
 0,73
 0 (0) 0
 2 (2) 2
 0,23
 1 (1,1) 1
 1 (1,0) 1
 1,00
          Obs: observation arm; RM: rituximab maintenance arm.
1.6-10.3) to 4.68 g/L (range, 1.0-9.5), from period 1 to period 4, respectively. Median rates of Ig significantly dif- fered between the two arms in periods 3 and 4: 6.11 g/L (range, 1.2-12.9) versus 4.70 g/L (range, 1.2-9.1), P<0.0001 and 6.41 g/L (range, 0.6-11.7) versus 4.68 (range, 1.0-9.5), P<0.0001, for the Obs and RM arms, respectively.
T CD4 lymphopenia
Concerning T CD4 lymphopenia, there was no difference between the two arms for any of the periods, P=0.70, P=0.73, P=0.23 and P=1.0, in chronological order respect- ively (Table 2). In the Obs arm, median rates of T CD4 lym- phocytes increased from 0.320x10⁹/L (range, 0.0-0.980) to 0.670x10⁹/L (range, 0.100-1.312) in periods 1 to 4. These values were respectively 0.300x10⁹/L (range, 0.0-1.021) and 0.630x10⁹/L (range, 0.200-0.885) the in RM arm. Median rate did not differ between the two arms during any of the periods: P=0.83, P=0.44, P=0.08 and P=0.45, in chronologi- cal order respectively.
Biological events are reported in Figure 2.
γ globulin substitution
In the Obs arm, five of 120 patients (4.2%) received 45 substitutions, while in the RM arm, 23 of 119 patients (19.3%) received 273 substitutions, P=0.0002. In period 4, one patient of 89 (1.1%) received three substitutions in the Obs arm while 19 of 97 (19.6%) received 165 substitutions in the RM arm, P<0.0001, Table 1. For those patients sub- stituted, median number of substitutions was 8 (range, 1- 19) in the Obs arm versus 6 (range, 1-82) in the RM arm, which was not different, P=0.93. Correlation analysis showed that Ig substitution was correlated with hypo- gammaglobulinemia <6 g/L and <4 g/L (P=0.035 and
P<0.001, respectively) and occurrence of infectious epi- sodes (P=0.002). As of the first substitutive injection, the number of hypogammaglobulinemia <6 g/L and <4 g/L events was significantly reduced, the median difference (before-after) being 3.5 events, P=0.037. However, the median number of infectious episodes within patient (be- fore-after) was not reduced with Ig substitution, even after a dozen of injections, P=0.09.
Impact of immune restoration and occurrence of infectious events on progression-free survival and overall survival
Occurrence of infectious events did not impact PFS or OS in either arm (Obs arm, PFS P=0.31 and OS P=0.55; RM arm PFS P=0.13 and OS P=0.09) nor did it impact PFS or OS in the whole cohort (PFS P=0.08 and OS P=0.16). This was also noted for the occurrence of neutropenia (Obs arm, PFS P=0.16 and OS P=0.26; RM arm PFS P=0.96 and OS P=0.21; whole cohort PFS, P=0.28 and OS P=0.10). In contrast, occurrence of hypogammaglobulinemia <6 g/L (n=86/120; 71.6% in the Obs arm and n=103/119, 86.3% in the RM arm, n=189/239; 79.1% in the whole cohort) was correlated with an improved 36 months PFS in the whole cohort (85.6% vs. 63.6%, P=0.0005; Figure 3A), with a treatment arm adjusted hazard ratio (HR)=0.488 (95% CI: 0.287-0.830; P=0.008). In the RM arm, 36 months PFS was also improved in patients with hypogammaglobulinemia (93.2% vs. 63.5%, P=0.008; Figure 3B, HR=0.294; 95%CI: 0.113-0.767). In the Obs arm, this was not significant, P=0.09. For a hypogammaglobulinemia cutoff at 4 g/L (n=40/120, 33.3% in the Obs arm; n=71/119, 59.7% in RM arm and n=111/239, 46.4% in the whole cohort), PFS also correlated with occurrence of hypogammaglobulinemia,
Haematologica | 107 September 2022
2167
