
Page 23 - Haematologica May 2022
P. 23
Lymphoblastic leukaemia, paediatric, clofarabine
Toxicity
No statistically significant differences in the incidence of severe or persistent toxicities between randomized treat- ment elements or in the subsequent treatment realization were documented (Figure 4; Online Supplementary Table S2A and B). In particular, severe grade 3 or 4 skin toxicities were not observed in either treatment arm, but clofarabine was more frequently associated with grade 2 skin toxicities. With regard to hepatotoxicity, an elevation of transaminases (aspartate and alanine transaminases [AST and ALT], respec- tively) was significantly more often reported after clofara- bine than after HIDAC, and then spontaneously resolved without exception after each randomized treatment ele- ment before the start of subsequent chemotherapy. Accordingly, time intervals between the randomized cours- es and the subsequent treatment elements were similar, with a median of 22 days (range, 20–38 days) after clofara- bine/PEG-ASP and 19 days (range, 18–38 days) after HIDAC/PEG-ASP. Incidence and degree of myelotoxicity differed slightly between clofarabine and HIDAC (Figure 4;
Online Supplementary Table S2A and B). Remarkably, when comparing CTC grades 0 to 2 against grades 3 and 4 for hemoglobin and platelets, clofarabine was associated with significantly less severe toxicities (Online Supplementary Table S2B). Clofarabine caused a more frequent grade 4 depletion of white blood cells suggesting a greater lymphotoxicity given that grade 4 reduction in neutrophil counts was com- parable between randomized arms (Figure 4; Online Supplementary Table S2A). Nevertheless, the incidence of severe infections after randomized treatment was compara- ble (Figure 4; Online Supplementary Table S2A and B). Finally, the incidence of serious adverse events (SAE) during the remaining treatment courses was very similar (18 and 19 SAEintheclofarabinevs.HIDACarm,respectively).
Discussion
As demonstrated in trial CoALL 08-09, clofarabine com- bined with PEG-asparaginase is effective in the eradication
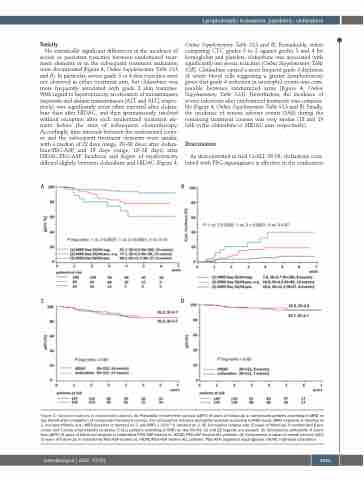
AB
CD
Figure 3. Outcome analyses in randomized patients. (A) Probability of event-free survival (pEFS) (5 years of follow-up) in randomized patients according to MRD on
day 50/64 after completion of randomized treatment courses. For comparative outcome probability analyses according to MRD levels, MRD negativity is denoted as 1, non-quantifiable (n.q.) MRD positivity is denoted as 2, and MRD ≥ 1x10⁻⁴ is denoted as 3. (B) Cumulative relapse rate (5 years of follow-up) in randomized B-pre- cursor and T-acute lymphoblastic leukemia (T-ALL) patients according to MRD on day 50/64. (C) and (D) legends are swoped. (C) Comparative probability of event- free (pEFS) (5 years of follow-up) analysis in clofarabine/PEG-ASP-treated vs. HIDAC/PEG-ASP-treated ALL patients. (D) Comparative analysis of overall survival (pOS) (5 years of follow-up) in clofarabine/PEG-ASP-treated vs. HIDAC/PEG-ASP-treated ALL patients. PEG-ASP: pegylated asparaginase; HIDAC: high-dose cytarabine.
haematologica | 2022; 107(5)
1031
