
Page 21 - Haematologica May 2022
P. 21
Lymphoblastic leukaemia, paediatric, clofarabine
negativity, and a lower rate of patients with quantifiable MRD levels (6 patients after clofarabine vs. 18 patients after HIDAC) (Cochran-Armitage trend test P=0.01; Table 2; Online Supplementary Figure S1). This observation holds true in a sub-analysis of the patients with a higher burden of EOI MRD (≥10-3) who were stratified to the low risk (LR)- or HR-intensified arms. Among those 73 patients, 27 patients were MRD-negative after clofarabine compared to 16 patients randomized to the HIDAC arm (Cochran- Armitage trend test P=0.02). In ETV6-RUNX1-rearranged ALL, which occurred more frequently in clofarabine-treated patients by chance, we observed an equivalent efficacy of the randomized nucleosides, reflecting a generally high sen- sitivity toward asparaginase in this prognostically favorable genetic subgroup of ALL (Table 1; Online Supplementary Table S3). In order to address a potential skewing effect of misbalanced ETV6-RUNX1 on the MRD outcome of ran-
domized groups, ETV6-RUNX1-negative ALL was ana-
lyzed separately, which confirmed greater activity of clo-
farabine compared to HIDAC (P 2=0.04210) (Online
chi
Supplementary Table S3).
Importantly, after the randomized course in early con-
solidation (day 50 in B-cell precursor (BCP)-ALL and day 64 in T-ALL patients), MRD maintained its prognostic rel- evance, with a significant impact on EFS and relapse rate in comparison to day 29 EOI MRD (Figure 3A and B).15 T-ALL patients of both randomized arms achieved compa- rable MRD reductions by day 64, although the number of T-ALL patients was very small (Tables 1 and 2). Nevertheless, the test for trends in the overall cohort com- prising both BCP-ALL and T-ALL confirmed that clofara- bine was significantly more effective in MRD reduction compared to HIDAC (Cochran-Armitage trend test P=0.01) (Table 2).
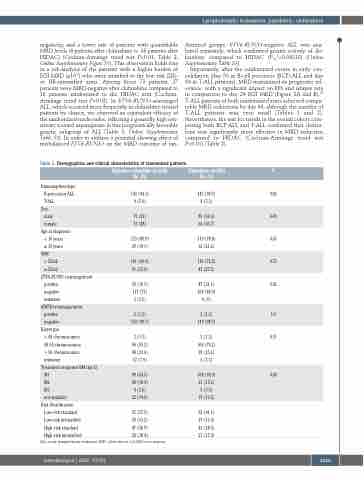
Table 1. Demographics and clinical characteristics of randomized patients. High-dose cytarabine (n=152)
Clofarabine (n=151) P No. (%)
143 (94.7) 0.82 8 (5.3)
85 (56.3) 0.45 66 (43.7)
119 (78.8) 0.65 32 (21.2)
110 (72.8) 0.73 41 (27.2)
47 (31.1) 0.02 104 (68.9)
0 (0)
2 (1.3) 1.0 149 (98.7)
2 (1.3) 0.31 106 (70.2)
38 (25.2) 5 (3.3)
104 (68.9) 0.68 23 (15.2)
5 (3.3) 19 (12.6)
62 (41.1) 19 (12.6) 43 (28.5) 27 (17.9)
Immunophenotype B-precursor ALL T-ALL
Sex male
female
Age at diagnosis
< 10 years
≥ 10 years WBC
< 25/nL
≥ 25/nL
ETV6-RUNX1 rearrangement
positive negative unknown
KMT2A rearrangement positive
negative
Karyotype
< 44 chromosomes 44-50 chromosomes > 50 chromosomes unknown
Treatment response BM day 15 M1
M2
M3
not available
Risk Stratification Low-risk standard Low-risk intensified High-risk standard High-risk intensified
No. (%)
143 (94.1) 9 (5.9)
79 (52) 73 (48)
123 (80.9) 29 (19.1)
101 (66.4) 51 (33.6)
30 (19.7) 117 (77) 5 (3.3)
2 (1.3) 150 (98.7)
2 (1.3) 90 (59.2) 48 (31.6) 12 (7.9)
98 (64.5) 28 (18.4) 4 (2.6) 22 (14.5)
57 (37.5) 20 (13.2) 47 (30.9)
28 (18.4)
ALL: acute lymphoblastic leukemia; WBC: white blood cell; BM: bone marrow.
haematologica | 2022; 107(5)
1029
