
Page 129 - Haematologica May 2022
P. 129
GECPAR, eRNA master regulator of germinal center
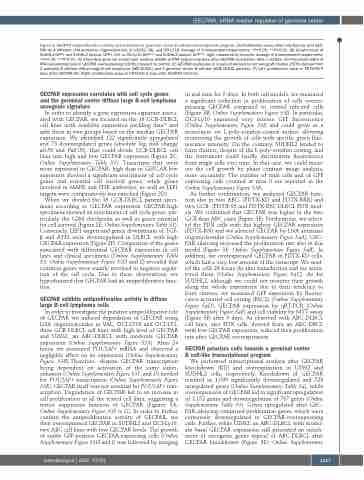
Figure 3. GECPAR antiproliferative activity and activation of germinal center B cell-like transcriptional program. (A) Proliferation assay after interference with GEC- PAR by 4 different LNA antisense oligonucleotides in U2932, VAL and OCI-LY18. Average of 3 independent experiments, *P<0.05, **P<0.01. (B) Growth curve of SUDHL2 GFP+ and SUDHL2 Gecpar- GFP+, left, or OCI-Ly10 GFPbright and SUDHL2 Gecpar- GFPbright, right, measured by Incucyte. Average of 3 independent experiments, *P<0.05, **P<0.01. (C) Preranked gene set enrichment analysis (GSEA) of RNA sequencing data after GECPAR knockdown (KD) in U2932. (D) Preranked GSEA of RNA sequencing data in GECPAR overexpressing SUDHL2 respect to control. (E) GECPAR expression in 4 patient-derived tumor xenograft models (PDTX) derived from 2 activated B cell-like diffuse large B-cell lymphoma (ABC-DLBCL) and 2 germinal center B cell-like (GCB)-DLBCL patients. (F) Left: proliferation assay in PDTX-RN 5 days after GECPAR KD. Right: proliferation assay in PDTX-KD 9 days after GECPAR infection.
GECPAR expression correlates with cell cycle genes and the germinal center diffuse large B-cell lymphoma oncogenic signature
In order to identify a gene expression signature associ- ated with GECPAR, we focused on the 16 GCB-DLBCL cell lines with available expression profiling data44 and split them in two groups based on the median GECPAR expression. We identified 122 significantly upregulated and 73 downregulated genes (absolute log2 fold change ≥0.59 and P≤0.05), that could divide GCB-DLBCL cell lines into high and low GECPAR expressers (Figure 2C; Online Supplementary Table S1). Transcripts that were more expressed in GECPAR- high than in GEPCAR-low expressers showed a significant enrichment of cell cycle genes and essential cell survival genes, while genes involved in MAPK and PI3K pathways, as well as LEF1 targets were comparatively less enriched (Figure 2D).
When we divided the 16 GCB-DLBCL patient speci- mens according to GECPAR expression GECPAR-high specimens showed an enrichment of cell cycle genes, par- ticularly the G2M checkpoint as well as genes essential for cell survival (Figure 2E; Online Supplementary Table S2). Conversely, LEF1 targets and genes downstream of TGF- β and ATF2 were downregulated in DLBCL with high GECPAR expression (Figure 2F). Comparison of the genes associated with differential GECPAR expression in cell lines and clinical specimens (Online Supplementary Table S3; Online Supplementary Figure S2D and E) revealed that common genes were mainly involved in negative regula- tion of the cell cycle. Due to these observations, we hypothesized that GECPAR had an antiproliferative func- tion.
GECPAR exhibits antiproliferative activity in diffuse large B-cell lymphoma cells
In order to investigate the putative antiproliferative role of GECPAR we induced degradation of GECPAR using LNA oligonucleotides in VAL, OCI-LY18 and OCI-LY1, three GCB DLBCL cell lines with high level of GECPAR and U2932, an ABC-DLBCL with moderate GECPAR expression (Online Supplementary Figure S3A). After 24 hours we measured POU2AF1 mRNA and observed a negligible effect on its expression (Online Supplementary Figure S3B).Therefore, despite GECPAR transcription being dependent on activation of the same super- enhancer (Online Supplementary Figure S3C and D) needed for POU2AF1 transcription (Online Supplementary Figure S3E), GECPAR itself was not essential for POU2AF1 tran- scription. Degradation of GECPAR led to an increase in cell proliferation in all the tested cell lines, suggesting a tumor suppressor function of GECPAR (Figures 3A; Online Supplementary Figure S3F to G). In order to further confirm the antiproliferative activity of GECPAR, we then overexpressed GECPAR in SUDHL2 and OCI-Ly10, two ABC cell lines with low GECPAR levels. The growth of stable GFP-positive GECPAR-expressing cells (Online Supplementary Figure S3H and I) was followed by imaging
in real time for 5 days. In both cell models, we measured a significant reduction in proliferation of cells overex- pressing GECPAR compared to control infected cells (Figure 3B; Online Supplementary Figure S3J). In particular, OCI-Ly10 expressed very intense GFP fluorescence (Online Supplementary Figure S3I) and could grow as a monolayer on L-poly-ornithin-coated surface allowing monitoring the growth of cells with specific green fluo- rescence intensity. On the contrary, SUDHL2 tended to form clusters, despite of the L-poly-ornithin coating, and the instrument could hardly discriminate fluorescence from single cells over time. In that case, we could meas- ure the cell growth by phase contrast image analysis, more accurately. The number of total cells and of GFP expressing cells counted at time 0 are reported in the Online Supplementary Figure S3K.
As further confirmation, we analyzed GECPAR func- tion also in two ABC- (PDTX-KD and PDTX-RRR) and two GCB- (PDTX-SS and PDTX-RN) DLBCL PDX mod- els. We confirmed that GECPAR was higher in the two GCB than ABC cases (Figure 3E). Furthermore, we select- ed the PDX cells with the highest GECPAR expression (PDTX-RN) and we silenced GECPAR by LNA antisense oligonucleotides (Online Supplementary Figure S4A). GEC- PAR silencing increased the proliferation rate also in this model (Figure 3F; Online Supplementary Figure S4B). In addition, we overexpressed GECPAR in PDTX-KD cells, which had a very low amount of the transcript. We seed- ed the cells 24 hours (h) alter transduction and we moni- tored them (Online Supplementary Figure S4C). As for SUDHL2, although we could not monitor their growth along the whole experiment due to their tendency to form clusters, we measured GFP expression by fluores- cence-activated cell sorting (FACS) (Online Supplementary Figure S4D), GECPAR expression by qRT-PCR (Online Supplementary Figure S4E) and cell viability by MTT assay (Figure 3F) after 9 days. As observed with ABC-DLBCL cell lines, also PDX cells, derived from an ABC-DBCL with low GECPAR expression, reduced their proliferation rate after GECPAR overexpression.
GECPAR polarizes cells towards a germinal center B cell-like transcriptional program
We performed transcriptional analysis after GECPAR knockdown (KD) and overexpression in U2932 and SUDHL2 cells, respectively. Knockdown of GECPAR resulted in 1,099 significantly downregulated and 528 upregulated genes (Online Supplementary Table S4), while overexpression of GECPAR led to significant upregulation of 3,152 genes and downregulation of 787 genes (Online Supplementary Table S5). Genes upregulated after GEC- PAR silencing comprised proliferation genes, which were conversely downregulated in GECPAR-overexpressing cells. Further, while U2932, an ABC-DLBCL with moder- ate basal GECPAR expression still presented an enrich- ment of oncogenic genes typical of ABC-DLBCL after GECPAR knockdown (Figure 3D; Online Supplementary
haematologica | 2022; 107(5)
1137
