
Page 131 - Haematologica May 2022
P. 131
GECPAR, eRNA master regulator of germinal center
AB
CE
D
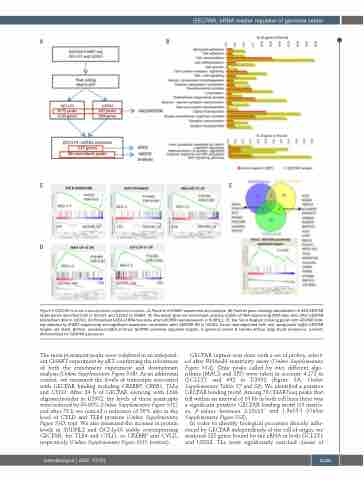
Figure 5 GECPAR in trans transcriptional regulatory function. (A) Pipeline of CHART experiment and analysis. (B) Panther gene ontology classification of 325 GECPAR target genes identified both in OCI-LY1 and U2932 by CHART. (C) Preranked gene set enrichment analysis (GSEA) of RNA sequencing (RNA-Seq) data after GECPAR knockdown (KD) in U2932. (D) Preranked GSEA of RNA-Seq data after GECPAR overexpression in SUDHL2. (E) Top: Venn diagram crossing genes with GECPAR bind- ing detected by CHART sequencing and significant expression modulation after GECPAR KD in U2932. Direct downregulated (left) and upregulated (right) GECPAR targets are listed. Bottom, preranked GSEA of direct GECPAR positively regulated targets, in germinal center B cell-like diffuse large B-cell lymphoma patients dichotomized for GECPAR expression
The most prominent peaks were validated in an independ- ent CHART experiment by qRT, confirming the robustness of both the enrichment experiment and downstream analysis (Online Supplementary Figure S5B). As an additional control, we measured the levels of transcripts associated with GECPAR binding including CREBBP, CREB5, TLE4 and CYLD. After 24 h of GECPAR silencing with LNA oligonucleotides in U2932, the levels of these transcripts were reduced by 50-80% (Online Supplementary Figure S5C) and after 72 h we noticed a reduction of 50% also in the level of CYLD and TLE4 proteins (Online Supplementary Figure S5D, top). We also measured the increase in protein levels in SUDHL2 and OCI-Ly10 stably overexpressing GECPAR, for TLE4 and CYLD, or CREBBP and CYLD, respectively (Online Supplementary Figure S5D, bottom).
GECPAR capture was done with a set of probes, select- ed after RNAseH sensitivity assay (Online Supplementary Figure S5A). Only peaks called by two different algo- rithms (MACS and SPP) were taken in account: 4,172 in OCI-LY1 and 692 in U2932 (Figure 5A, Online Supplementary Tables S7 and S8). We identified a putative GECPAR binding motif. Among 78 CHARTseq peaks that fell within an interval of 10 kb in both cell lines there was a significant putative GECPAR binding motif (13 match- es, P-values between 2.15x10⁻⁷ and 1.9x10⁻⁹) (Online Supplementary Figure S5E),
In order to identify biological processes directly influ- enced by GECPAR independently of the cell of origin, we analysed 325 genes bound by the eRNA in both OCI-LY1 and U2932. The most significantly enriched classes of
haematologica | 2022; 107(5)
1139
