
Page 105 - Haematologica May 2022
P. 105
CAR-T for elderly patients with DLBCL
tion, n=3; out of specification and progression of second- ary malignancy, n=1; progression of DLBCL, n=2). One patient had an out of specification product due to low via- bility of CAR-T cells, however the product was infused.
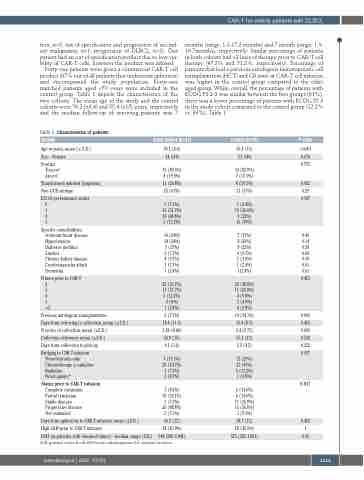
Forty-one patients were given a commercial CAR-T cell product (87% out of all patients that underwent apheresis) and encompassed the study population. Forty-one matched patients aged <70 years were included in the control group. Table 1 depicts the characteristics of the two cohorts. The mean age of the study and the control cohorts were 76.2 (±4.4) and 55.4 (±15) years, respectively and the median follow-up of surviving patients was 7
months (range, 1.3-17.2 months) and 7 month (range, 1.3- 16.7months), respectively. Similar percentage of patients in both cohorts had >2 lines of therapy prior to CAR-T cell therapy (47.3% and 51.2%, respectively). Percentage of patients that had a previous autologous hematopoietic cell transplantation (HCT) and CR state at CAR-T cell infusion was higher in the control group compared to the older aged group. While, overall, the percentage of patients with ECOG PS 2-3 was similar between the two groups (61%), there was a lower percentage of patients with ECOG PS 3 in the study cohort compared to the control group (12.2% vs. 39%), Table 1.
Table 1. Characteristics of patients Domain
Age in years, mean (± S.D.)
Sex – Female
Product Tisa-cel
Axi-cel
Transformed indolent lymphoma Non-GCB subtype
ECOG performance status 0
1 2 3
Specific comorbidities Ischemic heart disease Hypertension
Diabetes mellitus Smoker
Chronic kidney disease Cerebrovascular attack Dementia
N lines prior to CAR-T 2
3 4 5 >5
Previous autologous transplantation
Days from referring to collection, mean (±S.D.) N cycles of collection, mean (±S.D.)
Collection efficiency, mean (±S.D.)
Days from collection to pick-up
Bridging to CAR-T infusion None/steroids only Chemotherapy ± radiation Radiation
Novel agents*
Status prior to CAR-T infusion
Complete remission Partial remission Stable disease Progressive disease Not evaluated
Days from apheresis to CAR-T infusion, mean (±S.D.)
High LDH prior to CAR-T infusion
LDH (in patients with elevated values) - median, range (U/L)
Study Cohort (n=41)
76.2 (4.4) 24, 61%
33 (80.5%) 8 (19.5%)
11 (26.8%) 25 (61%)
3 (7.3%) 13 (31.7%) 20 (48.8%) 5 (12.2%)
10 (24%) 14 (34%) 7 (17%) 3 (7.3%) 4 (9.7%) 3 (7.3%) 1 (2.4%)
22 (53.7%) 13 (31.7%) 5 (12.2%) 0 (0%)
1 (2.4%)
3 (7.3%) 18.8 (11.3) 2.46 (0.64) 52.9 (15) 4.1 (3.6)
7 (17.1%) 29 (70.7%) 3 (7.3%) 2 (4.9%)
7 (8.5%) 30 (34.1%) 3 (7.3%) 20 (48.8%) 3 (7.3%)
36.5 (12)
18 (43.9%)
548 (380-2,041)
Control (n=41)
55.4 (15) 23, 54%
34 (82.9%) 7 (17.1%)
8 (19.5%) 21 (51%)
1 (2.4%) 15 (36.6%) 9 (22%) 16 (39%)
7 (17%) 8 (20%) 9 (22%) 4 (9.7%) 2 (4.9%) 1 (2.4%) 1(2.4%)
20 (48.8%) 11 (26.8%) 4 (9.8%) 2 (4.9%) 4 (9.8%)
14 (34.1%) 15.4 (8.9) 2.4 (0.75) 55.3 (13) 5.5 (4.5)
12 (29%) 23 (56%) 5 (12.2%) 1 (2.8%)
6 (14.6%) 6 (14.6%) 11 (26.8%) 15 (36.6%) 3 (7.3%)
38.7 (12)
18 (43.9%) 575 (382-1,891)
P-value <0.001
0.674 0.775
0.432 0.29 0.187
0.41 0.14 0.58 0.69 0.39 0.61 0.61
0.453
0.003 0.453 0.696 0.530 0.232 0.417
0.017
0.453 1 0.65
GCB: germinal center B cell; LDH: lactate dehydrogenase; S.D.: standard deviation.
haematologica | 2022; 107(5)
1113
