
Page 94 - 2022_03-Haematologica-web
P. 94
J.T. Weinreb et al.
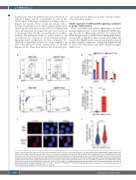
mutant gata1:dsred+ progenitors showed a reduction of cells in S phase and an accumulation of cells in the G0/G1 and G2/M phases compared to sibling controls (Figures 4A and B). These results are in-line with a decrease in proliferation in ddx41 mutant erythrocytes caused by cell cycle arrests at the G0/G1-to-S phase and G2-to-M transitions. Prolonged cell cycle arrest can lead to apoptosis,31 thus we also assessed apoptosis in ddx41 mutants. We measured levels of active caspase-3, an essential executor of apoptosis, in ddx41 mutant and sib- ling gata1:dsred+ erythrocytes by flow cytometry. We observed a significant increase in active caspase-3 in ddx41 mutant gata1:dsred+ erythrocytes at 30 hpf (Figures 4C-D). These data indicate that both cell cycle
arrest and elevated apoptosis in ddx41 mutant erythro- cytes may drive anemia.
Ddx41 regulation of ATM and ATR signaling contributes to proper erythropoiesis
These molecular and cellular phenotypes in ddx41 mutants imply that loss of ddx41 could promote DNA dam- age. In order to address this question, we analyzed the DNA damage response (DDR) by performing immunofluo- rescence (IF) for γH2AX in ddx41 mutants and siblings. We showed that γH2AX levels were increased nearly two-fold in ddx41 mutants compared to sibling cells (Figures 4E and F). These data demonstrate that ddx41 deficiency triggers DDR in vivo.
AB
CD
EF
Figure 4. Ddx41 deficiency triggers cell cycle arrest and DNA damage response in erythroid progenitors. (A) Cell cycle analysis of gata1:dsred+ erythroid cells from sibling controls (left) and ddx41 mutants (right) after a 2-hour pulse of 5-ethynyl-2′-deoxyuridine (EdU) at 28 hpf. EdU incorporation (y-axis) and DAPI content (x-axis) were measured by flow cytometry at 30 hours post fertilization (hpf). (B) Quantification of the percentage of cells in each cell cycle phase from (A). (C) Flow cytometry analysis of active-caspase 3 in gata1:dsred+ erythroid cells from sibling controls (left) and ddx41 mutants (right). (D) Quantification of the percentage of gata1:dsred+ erythroid cells that are active caspase-3-positive from (C). (E) Confocal images showing immunofluorescence of nuclei (DAPI) and γH2AX in cells isolated from 28 hpf siblings (top) and ddx41 mutants (bottom). scale bars =5 mm. (F) Quantification of γH2AX levels from (E). Graphs display means ± standard deviations (stds) with P- values calculated with unpaired Student’s t-test, *P<0.05, **P≤0.01, ***P≤0.001, ****P≤0.0001. For flow cytometry, n=3-5 pools of ~5-20 embryos per pool. For immunofluorescence imaging, n=100-300 cells per genotype.
650
haematologica | 2022; 107(3)
