
Page 93 - 2022_03-Haematologica-web
P. 93
Ddx41 function in erythropoiesis
ABC
DE
FG
H
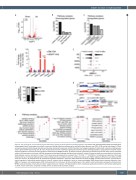
Figure 3. Cell cycle genes are mis-expressed and alternatively spliced in ddx41 mutant erythroid progenitors. (A) Volcano plot displaying differentially expressed genes between gata1:dsred+ erythrocytes from ddx41 mutants and siblings. Significant differences are defined as false discovery rate (FDR) <0.05 and log fold-change ≥1. Black
2
vertical lines denote the fold-change threshold and the black horizontal line denotes the FDR threshold. Five biological replicates for both ddx41 mutants and siblings were used to generate RNA sequencing data. (B and C). Representative charts of pathways significantly enriched in genes downregulated (B) or upregulated (C) in ddx41 mutant erythroid progenitors compared to sibling controls as determined by MSigDB analysis. (D) Graph of reverse transcription quantitative polymerase chain reaction (RT-qPCR) analysis of the expression of cell cycle and DNA damage-associated genes between sibling controls and ddx41 mutants. Expression levels were normalized to β-actin levels. Graph displays means ± standard error mean. The P-values were calculated with an unpaired t-test, *P<0.05, ****P≤0.0001; n=3 replicates per experiment. (E) Graph depicting the Dψ of individual splicing events between sibling controls and ddx41 mutants as detected by analysis with rMATS. Significant differences are defined as FDR ≤0.01 and Dψ ≥0.1. SE: skipped exons; RI: retained introns; A5SS: alternative 5’ splice site; A3SS: alternative 3’ splice site; MXE: mutually exclusive exons. (F) Graph depict- ing the frequency of alternatively spliced isoforms in ddx41 mutants that are predicted to result in nonsense-mediated (NMD) decay, protein sequence alterations (non- NMD), or changes in untranslated regions (UTR). (G) Sashimi plot for smc5 (exons 18-19) and stat1a (exons 2-4) in ddx41 mutant erythrocytes compared to sibling controls. RPKM: reads per kilobase of transcript per million mapped reads; Inc: inclusion. (H) Representative charts of pathways significantly enriched in alternatively spliced genes
in ddx41 mutant erythrocytes compared to sibling controls as determined by pathway analysis.
haematologica | 2022; 107(3)
649
