
Page 62 - 2022_03-Haematologica-web
P. 62
J. Bloehdorn et al.
the prognostic variable combinations (Figure 2A to F).
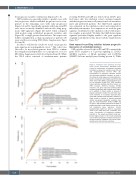
GEP variables are especially suitable to predict cases with late progression, while established prognostic factors com- pensate in the remaining cases with early progression (Figure 1A and B). Specifically, patients with long-term PFS were more accurately identified with models using prog- nostic GEP signatures (Figure 2D and F) when compared with models using established prognostic variables only (Figure 2B) or single genetic characteristics. This aspect was further exemplified in a subgroup analysis for patients <60 years and those receiving FCR (Online Supplementary Figure
S1A and B).
In order to validate the results we tested our prognostic
gene signature in an independent cohort.22 This cohort was selected to be most heterogeneous from CLL8 to confirm the strength and independence of our prognostic score for OS (Online Supplementary Table S2A; Figure 2E and F). While the CLL8 cohort consisted of treatment-naive patients
A
receiving FC/FCR and GEP was derived from CD19+ puri- fied tumor cells, the validation cohort contained samples with heterogeneous tumor cell purity from both treatment- naive and pretreated patients. The CLL8-based signature was estimated on the validation cohort and evaluated for individual performance. For comparison, we used the gene signature established for the validation cohort with respec- tive weights as provided.22 Notably, the CLL8-derived gene signature performed highly similar to the gene signature originally established for this dataset (Online Supplementary Figure S2).22
Gene expression profiling variables balance prognostic inaccuracy of established markers
GEP variables selected both for OS and PFS contained the genes RGS1 (regulator of G protein signaling 1), LDOC1 (LDOC1 regulator of NF-κB signaling) and L3MBTL4 (L3MBTL histone methyl-lysine binding protein 4). While
Figure 1. Prediction error estimates for prog- nostic model combinations. Prediction error curves for combinations of prognostic variables in models are shown for overall survival (OS) (A) and progression-free survival (PFS) (B). Combinations of prognostic variables contain the confirmed prognostic variables, as used in the reference model (age, sex, study medication, Eastern Cooperative Oncology Group [ECOG], log white blood cells [WBC], β2-microglobulin [β2- m], log thymidine kinase [TK], IGHV mutation status, del(11q), del(13q), del(17p), trisomy 12, TP53 mutation, NOTCH1 mutation, SF3B1 mutation) and gene expression profiling (GEP) variables. Prognostic GEP variables were select- ed in addition to (fixed model) or instead of (equally penalized model) the confirmed prog- nostic variables. In a separate approach prog- nostic GEP variables were selected in addition to (fixed model) or instead of (equally penalized model) non-genetic prognostic variables (only age, sex, study medication, ECOG, log WBC, log TK, β2-m). GEP variables selected in the fixed or equally penalized model largely overlap with the full prognostic gene signature (Online Supplementary Table S2), which is separately used in the “GEP data only” prediction error curve. Combination of prognostic variables selected in the equally penalized model per- formed highly similar to the model containing only confirmed prognostic variables. Strong over- lap was found for prediction error curves repre- sented by the red and blue solid lines.
B
618
haematologica | 2022; 107(3)
