
Page 63 - 2022_03-Haematologica-web
P. 63
GEP for high dimensional prognostic models in CLL
AB
CD
EF
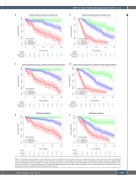
Figure 2. Conditional Kaplan-Meier survival estimates illustrate the distribution for overall survival and progression-free survival within the different prediction models. Kaplan-Meier estimates were generated for the lowest, the median, and the highest observed values of the prognostic variable combinations. Kaplan-Meier estimates illustrate overall survival (OS) (A, C and E) and progression-free survival (PFS) (B, D and F) with regard to the “reference model” (confirmed prognostic vari- ables only, A and B), the “equally penalized model” (confirmed prognostic variables and GEP equally penalized, C and D) and prognostic GEP signatures only (as rep- resented in the Online Supplementary Table S2A and B) (E and F).
haematologica | 2022; 107(3)
619
