
Page 60 - 2022_03-Haematologica-web
P. 60
J. Bloehdorn et al.
for the treatment with BTK inhibition or FCR.14 Therefore, identification of young and fit patients who specifically benefit from the treatment with FCR is needed to optimize long-term outcomes, in particular in the light of toxicity and cost associated with lifelong ibrutinib treatment. Additional biological characterization, such as gene expression profil- ing (GEP), may be helpful for further refinement of prog- nostic models leading to an increased prognostic accuracy and precise segregation of patients with a high treatment efficacy of FCR. Established markers mostly constitute cat- egorical variables or consensus cut-offs, in the case of IGHV mutation status, and therefore may not fully reflect the underlying biology. In addition, established prognostic markers may loose some of their impact with novel treat- ments.
Since such large-scale studies on randomized trials are scarce, we performed GEP on 337 baseline patient samples from the CLL8 trial and modeled different scenarios for the combined use with established prognostic factors. We iden- tified less than a dozen genes substituting for the prognostic impact of distinct recurrent alterations for PFS and overall survival (OS). Our results provide the basis for refined prog- nostic models and rational treatment selection.
Methods
Patients and samples
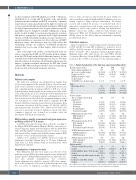
The study was conducted on peripheral blood samples from 337 previously untreated CLL patients (Table1) collected at enrol- ment on the CLL8 trial, a prospective, international, multi-center trial comparing first-line treatment with FC or FCR in a 1:1 ran- domized fashion. Further details for the study are provided online at the ClinicalTrials.gov (CTG) homepage (www.clinicaltrials.gov #NCT00281918).1 Ficoll density gradient centrifugation for isola- tion of mononuclear cells followed by an immunomagnetic tumor cell enrichment via CD19 (Midi MACS, Miltenyi Biotec®, Bergisch Gladbach, Germany) was performed on all samples. Data on genomic aberrations del(13q), trisomy 12, del(11q), del(17p) and mutation status for IGHV, TP53, SF3B1 and NOTCH1 was assessed as previously described.5 Informed consent and ethics committee approval was obtained in accordance with the Declaration of Helsinki for all patients.
RNA isolation, quality assessment and gene expression profiling on Exon ST 1.0 arrays
Total RNA was extracted from whole cell lysate according to the Allprep DNA/RNA mini kit (Qiagen). Quality control was per- formed using the Agilent 2100 Bioanalyzer with the RNA 6000 Nano LabChip (Agilent Technologies). In order to ensure accuracy and reproducibility, samples with an RNA integrity number (RIN) less than 7.0 were excluded from further analysis.
Samples were analyzed for mRNA expression using the Affymetrix GeneChip® Human Exon 1.0 ST Array (Affymetrix, Santa Clara, CA, USA). Further details are provided in the Online Supplementary Appendix.
Normalization of expression data
Raw Affymetrix data files were preprocessed by the robust multichip average (RMA) algorithm using the aroma.affymetrix R package (2008).15 Within RMA normalization, background correc- tion and quantile normalization was conducted. Aroma.affymetrix was applied to generate GEP values summa- rized on the exon/probe set level and on the transcript level using the ‘core’ probe set definition according to Affymetrix. ‘Core’
refers to probe sets that are supported by the most reliable evi- dence from RefSeq and full-length mRNA GenBank records con- taining complete coding sequences information. We further assessed and excluded the presence of potential batch effects induced by external factors such as time point and location of sampling as well as time point of labeling and hybridization. Quality control was further conducted with "Relative Log Expression” (RLE) and "Normalized Unscaled Standard Errors” (NUSE), where we also did not find any abnormalities indicating potential batch effects.
Statistical analyses
Data was analyzed to evaluate improvement of prognostication for PFS and OS by using GEP in addition to prognostic factors del(17p), del(11q), trisomy 12, del(13q), IGHV mutation status, SF3B1, NOTCH1, TP53 mutations, β2-microglobulin (β2-m), thymidine kinase (TK), white blood cell count (WBC), Eastern Cooperative Oncology Group (ECOG) performance status, study medication (FC or FCR), sex and age. For the following analyses,
Table 1. Patient characteristics of the CLL8 gene expression profiling cohort.
Baseline characteristics
Target analysis population, N
Age (years), median (range) Female sex, N (%)
ECOG performance status, median (range)
Total CIRS score, median (range)
Stage
Binet stage, N (%) A
B
C
Genetic variable
Type according to hierarchical model, N (%)
17p deletion
11q deletion
Trisomy 12
No abnormalities 13q deletion (single)
IGHV mutational status, N (%) IGHV unmutated
IGHV mutated
TP53 mutational status, N (%) TP53 unmutated
TP53 mutated
TP53 mutation and/or deletion
NOTCH1 mutational status, N (%) NOTCH1 unmutated
NOTCH1 mutated
SF3B1 mutational status, N (%) SF3B1 unmutated
SF3B1 mutated
Biologic variable
Telomere length (kb), median
(range)
Serum thymidine kinase (U/L), median
(range) (3.5-855.0) Serum β2-microglobulin (mg/L), median 2.9
FC 169
62 (36-81) 41 (24.3) 1 (0-1)
2 (0-7)
169
10 (5.9) 107 (63.3) 52 (30.8)
168
15 (8.9) 39 (23.2) 21 (12.5) 30 (17.9) 63 (37.5)
163 106 (65.0) 57 (35.0)
167 140 (83.8) 27 (16.2) 29 (17.4)
163 152 (93.3) 11 (6.7)
163 126 (77.3) 37 (22.7)
FCR 168
60 (35-77) 40 (23.8) 0 (0-2)
1.5 (0-7)
168 11 (6.5) 99 (58.9) 58 (34.5)
167
13 (7.8) 51 (30.5) 9 (5.4) 31 (18.6) 63 (37.7)
164 109 (66.5) 55 (33.5)
164 148 (90.2) 16 (9.8) 17 (10.4)
166 149 (89.8) 17 (10.2)
165 130 (78.8) 35 (21.2)
4.1 (2.6-15.3) 17.1 (2.7-970.0) 2.7 (0.9-8.0) 95.6 (12.6-363.0)
Total 337
61 (35-81) 81 (24.0) 0 (0-2)
2 (0-7)
337
21 (6.2) 206 (61.1) 110 (32.6)
335
28 (8.4) 90 (26.9) 30 (9.0) 61 (18.2) 126 (37.6)
327 215 (65.7) 112 (34.3)
331 288 (87.0) 43 (13.0) 46 (13.9)
329 301 (91.5) 28 (8.5)
328 256 (78.0) 72 (22.0)
4.2 (2.6-15.3) 20.1 (2.7-970.0) 2.8 (0.9-9.2) 94.9 (6.7-867.0)
4.2 (2.6-11.5) 23.4
(range)
Leukocyte count (G/L), median (range)
(1.1-9.2) 94.0 (6.7-867.0)
ECOG: Eastern Cooperative Oncology Group; CIRS: cumulative illness rating scale; FC: fludara- bine and cyclophosphamide FCR: fludarabine, cyclophosphamide and rituximab.
616
haematologica | 2022; 107(3)
