
Page 88 - 2022_02-Haematologica-web
P. 88
H. Schmid et al.
A
B
CD
E
F
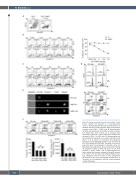
Figure 2. Culture-expanded invariant natural killer T cells induce dendritic cell apoptosis in a dose-dependent manner. (A) Representative dot plots showing absence of dendritic cells (DC) (CD11c+HLA-DR+) after co-culture with invariant natural killer T (iNKT) cells. (B) Representative dot plots and pooled data of living DC (annexin V-/propid- ium iodide [PI]-) after 4 hours (h) of co-culture with increasing numbers of T cells or iNKT cells. Indicated are the ratios of DC to T or iNKT cells. (C) Representative dot plots showing DC apoptosis in co-cultures with iNKT cells after 1, 2, 4, 6 and 8 h of incubation. (D) Histograms showing increased DNA fragmentation in DC after 4 h and 18 h of co-culture with iNKT cells. The gates on the left of each plot show the percentage of apoptotic nuclei. (E) Representative image stream assay and dot plots showing DC apoptosis induced by iNKT cells after 4 h and 18 h (annexin V+, green; 7-AAD+, red). (F) Representative dot plots, relative and absolute numbers of living DC (annexin V-/PI-) after 4 h of co-culture with different iNKT-cell sub- sets. Histograms show the mean of three independent experiments (n=3). Error bars indicate standard error of the mean. ns: not significant. HLA-DR: human leukocyte antigen DR-isotype.
430
haematologica | 2022; 107(2)
