
Page 130 - 2022_02-Haematologica-web
P. 130
M. Casale et al.
continued from previous page
D TSH†
D TSH index†
D BMD femur (g/cm2)†
D BMD L1-L4 (g/cm2)†
-0.1 (1.4)
-0.0 (0.8)
-0.0 (0.1)
-0.2 (0.7)
0.1 (1.5)
0.0 (0.8)
0.0 (0.3)
0.0 (0.1)
0.5 (5.1) 0.41
0.2 (0.9) 0.092
0.0 (0.2) 0.74
0.0 (0.2) 0.007
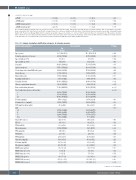
For normally-distributed variables, data are presented as mean (standard deviation [SD]) with P-value from ANOVA. For log-normal variables, data are presented as geometric mean (×/geometric SD) with P-value from ANOVA on logged values. For continuous variables with other types of distributions, data are presented as median (interquartile range [IQR]) with P-value from Kruskal-Wallis test. For categorical variables, data are presented as % (n/total) with P-value from Pearson's chi-squared test. *Measured at baseline, unless otherwise specified. †Intra-individual difference between measures taken at the end and at the beginning of the follow-up. DFX: deferasirox ; BMD: bone metabolism dis- order; LIC: liver iron concentration; EF: ejection fractions; FT4: free thyroxine; TSH: thyrotropin; PTH: parathyroid hormone.
Table 2B. Sample description stratified by categories of outcome measure. Factors and categories*
New incident
P-value 27.0 (11.8-35.4) 0.029
32.7% (34/104) 0.056 8.9 (3.7) 0.082 33.2 (11.1) 0.42
51.0% (53/104) 0.16 49.0% (51/104) 0.32 27.9% (29/104) 0.84 15.8% (15/95) 0.18 10.6% (11/104) 0.030
4.8% (5/104) 0.41 28.8% (30/104) 0.002 4.8% (5/104) 0.012
No N=322
30.5 (18.2-38.3) 23.3% (75/322) 7.5 (4.0) 34.2 (8.6) 43.2% (139/322) 54.7% (176/322) 28.9% (93/322) 10.7% (33/309) 19.9% (64/322) 3.1% (10/322) 46.3% (149/322) 14.0% (45/322) 70.8% (228/322)
23.3% (75/322) 27.0% (87/322) 49.7% (160/322)
979.3 (×/2.2) 18.5% (55/297) 4.1 (×/2.4)
37.3% (90/241) 33.2% (80/241) 22.8% (55/241) 6.6% (16/241)
32.9 (10.7) 64.0 (6.0) 2.1 (×/1.9) 15.8% (47/298) 14.5 (4.0) 2.7 (0.8) 25.1 (×/2.0) 89.3 (×/1.3) 9.3 (9.0-9.6) 4.1 (3.5-4.7) 0.7 (0.6-0.8) -1.7 (1.1) -1.9 (1.1) 0.8 (0.7-0.9) -2.3 (-3.0--1.6) -2.6 (-3.3--1.7)
Yes N=104
Age (years)
Pediatric patient (<16 years)
Age if child (n=109)
Age if adult (n=317)
Sex male
Splenectomised
Used drugs other than DFX in the past Heart disease
Thyroid disorder
Parathyroid disorder
Gonadal disorder
Glucose metabolism disorder
Bone metabolism disorder
N. of endocrine diseases at baseline 0
1 2+
Ferritin (ng/mL) Ferritin >2,000 (ng/mL) LIC (mg Fe/g dry weight)
LIC <3
3- 7- 15+
Heart T2* (msec) EF (%)
TSH (mIU/L)
On levotyroxine FT4 (pmol/L) TSH index
PTH (pg/mL) Glycemia (mg/dL) Calcium (mg/dL) Phosphorus (mg/dL) BMD femur (g/cm2) BMD femur (z score) BMD femur (t score) BMD L1-L4 (g/cm2) BMD L1-L4 (z score) BMD L1-L4 (t score)
41.3% (43/104)
41.3% (43/104) 32.7% (34/104) 26.0% (27/104)
<0.001 <0.001
995.8 (×/2.4) 0.86 22.6% (21/93) 0.39 4.2 (×/2.1) 0.85 0.51
36.6% (26/71) 40.8% (29/71) 15.5% (11/71) 7.0% (5/71)
34.1 (13.5) 0.46 63.2 (7.9) 0.41 2.5 (×/1.6) 0.019 8.2% (8/97) 0.063 14.5 (3.2) 0.92 2.8 (0.8) 0.24 21.8 (×/2.1) 0.26 86.8 (×/1.2) 0.29 9.3 (9.0-9.8) 0.41 4.0 (3.4-4.7) 0.54
0.8 (0.7-0.9) 0.050 -1.5 (1.3) 0.32 -1.5 (1.3) 0.079
0.9 (0.8-1.0) 0.019 -1.8 (-2.6--1.0) 0.020 -1.8 (-2.8--1.0) 0.003
continued on following page
472
haematologica | 2022; 107(2)
