
Page 132 - 2022_02-Haematologica-web
P. 132
M. Casale et al.
and risk of endocrine complications is controversial,20 since many studies have shown no correlation,21–23 confirming our results. This disconnection with iron-overload parameters has been observed also in chronic metabolic syndromes, although substantial evidence shows that the clinical course of these disorders is affected by iron overload.24 The differ- ent mechanisms of iron uptake and accumulation among different organs may be responsible of that phenomenon. Iron accumulates in the liver due to transferrin-mediated mechanisms and LIC has inadequate ability to predict that risk in extrahepatic organs.20 The endocrine glands and the
heart, instead, develop pathologic iron overload exclusively through uptake of non-transferrin bound iron (NTBI). The mechanism by which this uptake occurs is controversial, too, but L-type calcium must play a role as it is present in large quantities in cardiomyocytes, pancreatic b cells, in var- ious cell types of the anterior pituitary gland (including gonadotrophs, thyrotrophs, and corticoptrophs), and in the parathyroid-hormone-producing cells of the parathyroid gland.25 Although NTBI composes a very small fraction of body iron, it produces oxidative stress and organ damage.26 While elevated LIC increases patients’ risk of iron-overload
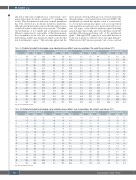
Table 4A. Predicted risk chart for developing a new endocrine disease within 5 years, in percentages. The overall 5-year risk was 9.7%
Diseases at baseline = 0 Diseases at baseline = 1 Diseases at baseline = 2 Diseases at baseline = 3
Age TSH=1 TSH=3 TSH=5 TSH=1 TSH=3 TSH=5 TSH=1 TSH=3 TSH=5 TSH=1 TSH=3 TSH=5
1 6.3 9.9 15.2 3.4 5.4 8.5 1.9 3.0 4.7 1.0 1.6 2.5 2 6.5 10.2 15.8 3.6 5.6 8.8 1.9 3.1 4.8 1.0 1.7 2.6 4 7.1 11.1 17.1 3.9 6.1 9.6 2.1 3.3 5.3 1.1 1.8 2.9 6 7.7 12.0 18.5 4.2 6.6 10.4 2.3 3.6 5.7 1.2 2.0 3.1 8 8.4 13.1 20.1 4.6 7.3 11.4 2.5 4.0 6.3 1.4 2.2 3.4 10 9.3 14.4 21.9 5.1 8.0 12.5 2.8 4.4 6.9 1.5 2.4 3.8 12 10.3 15.8 24.0 5.7 8.9 13.8 3.1 4.9 7.6 1.7 2.6 4.2 14 11.4 17.5 26.3 6.3 9.9 15.2 3.5 5.4 8.5 1.9 3.0 4.7 16 12.8 19.4 28.9 7.1 11.0 16.9 3.9 6.1 9.6 2.1 3.3 5.3 18 14.3 21.6 31.6 8.0 12.4 18.9 4.4 6.9 10.8 2.4 3.8 6.0 20 16.1 23.9 34.5 9.1 14.0 21.0 5.1 7.9 12.2 2.8 4.3 6.8 25 21.5 30.5 41.5 12.7 18.9 27.3 7.2 11.1 16.6 4.0 6.2 9.6 30 27.8 36.9 46.9 17.7 25.0 33.8 10.5 15.6 22.4 6.0 9.2 13.8 35 33.5 41.4 50.2 23.6 31.0 38.7 15.2 21.3 28.5 9.1 13.4 19.2 40 37.2 43.9 52.7 29.1 35.1 41.5 20.8 27.1 33.2 13.5 18.9 25.0 45 39.0 45.9 55.2 32.5 37.2 43.3 26.2 31.0 35.5 19.0 24.4 29.5 50 40.5 47.9 57.9 34.0 38.6 45.2 29.5 32.8 36.8 24.2 28.3 31.6
Age in years.TSH: thyrotropin.
Table 4B. Predicted risk chart for developing a new endocrine disease within 1 year, in percentages. The overall 1-year risk was 1.1%
Diseases at baseline = 0 Diseases at baseline = 1 Diseases at baseline = 2 Diseases at baseline = 3
Age TSH=1 TSH=3 TSH=5 TSH=1 TSH=3 TSH=5 TSH=1 TSH=3 TSH=5 TSH=1 TSH=3 TSH=5
1 0.6 1.0 1.6 0.3 0.5 0.9 0.2 0.3 0.5 0.1 0.2 0.3 2 0.7 1.1 1.7 0.4 0.6 0.9 0.2 0.3 0.5 0.1 0.2 0.3 4 0.7 1.1 1.8 0.4 0.6 1.0 0.2 0.3 0.5 0.1 0.2 0.3 6 0.8 1.3 2.0 0.4 0.7 1.1 0.2 0.4 0.6 0.1 0.2 0.3 8 0.9 1.4 2.2 0.5 0.7 1.2 0.3 0.4 0.6 0.1 0.2 0.3 10 1.0 1.5 2.4 0.5 0.8 1.3 0.3 0.4 0.7 0.1 0.2 0.4 12 1.1 1.7 2.7 0.6 0.9 1.5 0.3 0.5 0.8 0.2 0.3 0.4 14 1.2 1.9 3.0 0.6 1.0 1.6 0.3 0.6 0.9 0.2 0.3 0.5 16 1.4 2.1 3.4 0.7 1.2 1.8 0.4 0.6 1.0 0.2 0.3 0.5 18 1.5 2.4 3.9 0.8 1.3 2.1 0.4 0.7 1.1 0.2 0.4 0.6 20 1.8 2.8 4.4 1.0 1.5 2.4 0.5 0.8 1.3 0.3 0.4 0.7 25 2.6 4.1 6.3 1.4 2.2 3.5 0.8 1.2 1.9 0.4 0.6 1.0 30 3.9 6.1 9.3 2.1 3.4 5.3 1.2 1.8 2.9 0.6 1.0 1.6 35 6.1 9.2 13.6 3.4 5.2 8.0 1.9 2.9 4.5 1.0 1.6 2.5 40 9.3 13.6 19.1 5.4 8.2 12.1 3.0 4.7 7.1 1.7 2.6 4.1 45 14.0 19.1 24.6 8.5 12.4 17.4 4.9 7.5 11.0 2.8 4.3 6.5
50 19.5 24.4 28.4 13.0 17.8 22.8 7.9 11.6 16.1 4.6 7.0 10.3
Age in years.TSH: thyrotropin.
474
haematologica | 2022; 107(2)
