
Page 129 - 2022_02-Haematologica-web
P. 129
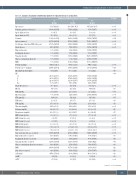
Endocrine complications in iron overload
Table 2A. Sample description stratified by number of endocrine diseases at baseline.
Factors and categories*
Age (years)
Pediatric patient (<16 years)
Age if child (n=109)
Age if adult (n=317)
Sex male
Splenectomised
Used drugs other than DFX in the past Heart disease
Thyroid disorder
Parathyroid disorder
Gonadal disorder
Glucose metabolism disorder
BMD
Ferritin (ng/mL)
Ferritin >2,000 (ng/mL)
LIC (mg Fe/g dry weight)
LIC <3
3- 7- 15+
Heart T2* (msec) EF (%)
TSH (mIU/L)
On levotyroxine FT4 (pmol/L) TSH index
PTH (pg/mL)
Glycemia (mg/dL)
Calcium (mg/dL)
Phosphorus (mg/dL)
BMD femur (g/cm2)
BMD femur (z score)
BMD femur (t score)
BMD L1-L4 (g/cm2)
BMD L1-L4 (z score)
BMD L1-L4 (t score)
New endocrine disease occurred Thyroid disorder occurred
Parathyroid disorder occurred
Gonadal disorder occurred
Glucose metabolism disorder occurred BMD
Side effect occurred
D Ferritin†
D LIC† D T2*†
Number of endocrine diseases at baseline
0 1 2+
P-value
<0.001 <0.001 <0.001 0.001 0.054 <0.001 0.002 <0.001
<0.001 0.023 0.18 0.34
<0.001 0.33 0.061 <0.001 0.54 0.39 0.19 <0.001 0.25 0.17 <0.001 <0.001 <0.001 <0.001 <0.001 <0.001 <0.001 0.39 0.18 0.74 0.36 0.22 0.28 0.62 0.93 0.008
N=118
9.1 (5.4-23.2) 68.6% (81/118) 6.9 (3.7) 31.3 (11.9) 50.8% (60/118) 23.7% (28/118) 27.1% (32/118) 4.4% (5/114) 0.0% (0/118) 0.0% (0/118) 0.0% (0/118) 0.0% (0/118) 0.0% (0/118) 1342.1 (×/2.0) 28.4% (29/102) 4.9 (×/2.4)
28.6% (20/70) 38.6% (27/70) 22.9% (16/70) 10.0% (7/70)
36.0 (11.3) 64.0 (6.6) 2.5 (×/1.5) 0.0% (0/104) 14.8 (3.3) 2.8 (0.7) 25.0 (×/1.6) 84.5 (×/1.1) 9.4 (9.1-9.7) 4.3 (3.5-5.0) 0.9 (0.8-1.0) -0.4 (1.5) -0.5 (1.5) 1.0 (0.9-1.1) -0.8 (-1.4--0.3) -0.8 (-1.4--0.3) 36.4% (43/118) 5.1% (6/118) 0.8% (1/118) 12.7% (15/118) 3.4% (4/118) 24.6% (29/118) 0.8% (1/118) -476.6 (1519.6) -1.4 (5.2) 0.7 (13.8)
N=121
28.9 (18.6-36.7) 17.4% (21/121) 10.9 (3.5) 32.0 (10.5) 49.6% (60/121) 47.9% (58/121) 18.2% (22/121) 7.8% (9/116) 6.6% (8/121) 1.7% (2/121) 11.6% (14/121) 0.0% (0/121) 80.2% (97/121) 937.2 (×/2.3) 18.3% (21/115) 4.0 (×/2.4)
43.2% (41/95) 27.4% (26/95) 22.1% (21/95) 7.4% (7/95)
35.7 (9.4)
62.9 (5.8) 2.1 (×/1.6) 5.2% (6/115) 14.2 (2.9) 2.6 (0.7) 27.3 (×/1.8) 84.2 (×/1.1) 9.3 (8.9-9.6) 4.1 (3.5-4.7) 0.7 (0.6-0.9) -1.5 (1.1) -1.6 (0.9) 0.8 (0.7-0.9) -2.1 (-2.9--1.3) -2.2 (-3.0--1.3) 28.1% (34/121) 8.8% (10/113) 1.7% (2/119) 12.1% (13/107) 2.5% (3/121) 41.7% (10/24) 4.1% (5/121) -310.8 (1419.9) -1.6 (6.6) 1.9 (11.5)
N=187
34.7 (29.6-39.7) 3.7% (7/187) 10.9 (3.9) 35.6 (7.3) 38.5% (72/187) 75.4% (141/187) 36.4% (68/187) 19.5% (34/174) 35.8% (67/187) 7.0% (13/187) 88.2% (165/187) 26.7% (50/187) 93.0% (174/187) 844.9 (×/2.2) 15.0% (26/173) 3.9 (×/2.2)
37.4% (55/147) 38.1% (56/147) 19.7% (29/147) 4.8% (7/147)
30.5 (12.0) 64.4 (6.8) 2.1 (×/2.1) 27.8% (49/176) 14.5 (4.6) 2.7 (0.9) 21.9 (×/2.3) 95.1 (×/1.3) 9.3 (9.0-9.7) 4.0 (3.4-4.5) 0.7 (0.6-0.8) -2.0 (1.0) -2.1 (1.0) 0.8 (0.7-0.9) -2.5 (-3.2--1.9) -2.8 (-3.4--2.0) 14.4% (27/187) 5.0% (6/120) 4.0% (7/174) 18.2% (4/22) 5.8% (8/137) 23.1% (3/13) 2.7% (5/187) -430.6 (1103.1) -1.8 (6.6) 5.9 (12.8)
continued on following page
haematologica | 2022; 107(2)
471
