
Page 109 - 2022_02-Haematologica-web
P. 109
Gene therapy of DBA
shown in Online Supplementary Tables S2 and S3. Particularly, the top ten integrations with the highest sequence contribution in each sample are depicted in Figure 7A and Online Supplementary Figure S9A. Overall, EFS-RPS19-transduced cells showed a highly polyclonal insertion site pattern, reflecting the overall integration preferences of lentiviral vectors. No integration site con- tributed with more than 5.37% in uninduced gene-cor- rected cells (Figure 7A) or 4.4% in gene-corrected Rps19- deficient cells (Online Supplementary Figure S9A) to the overall sequence pool, and there were no integrations in or close to known high-risk proto-oncogenes (Lmo2, Ccnd2 or Hmga2). However, one integration at 16.5 kb upstream of the high-risk locus Ikzf1 was detected (accounting for 1.65%), and another integration at 20.7 kb upstream of the high-risk gene Mecom was found (accounting for 0.04%) in recipients of gene-corrected Rps19-deficient BM cells. For the analysis of overlaps between integrations in or near the same genes among BM samples, we observed common lentiviral integration sites identified in previous integration site analysis (Online Supplementary Tables S4 and S5).31,32 We identified 11 integrations in or near the same refSeq genes between cohorts 1+2 and cohorts 3+4 (Online Supplementary Figure S10). Four of these shared common insertion sites in or near Hgf, Kdm6a, Lnpep and Mef2c also listed as proto- oncogenes in the All Onco database.25 The sole occur- rence of integration sites in or near high-risk loci was not an indication of a higher risk of insertional mutagenesis if no dominant clones were detected. The detected integra- tions might simply reflect that lentiviral vectors were capable of integrating at these genomic sites. We per- formed analysis of insertion site profile including param- eters of the integration site preferences close to CpG islands, GC-rich regions, in or near transcription units, the transcriptional start site of genes, gene boundaries or
proto-oncogenes (Figure 7B-D, Online Supplementary Figure S9B-D). More integrations were detected in a dis- tance of 100 kb relative to CpG islands, marking actively transcribed regions but not in the direct vicinity of CpG islands (1-10 kb), hence not close to the promoter region. Our data showed that GC rich regions (marking promoter regions of genes) and long intergenic regions were gener- ally disfavored by the vector. The integrations inside tran- scriptional units and in or close to proto-oncogenes (with- in a 100 kb window = onco.100k) are displayed relative to the matched random controls (Figure 7B, Online Supplementary Figure S9B).
The EFS-RPS19 vector rescued impaired erythroid differentiation of human RPS19-deficient CD34+ cord blood cells
We next examined the therapeutic effects of the EFS- RPS19 vector using human primary CD34+ cord blood cells. Since primary CD34+ cells from DBA patients are dif- ficult to obtain, we utilized previously validated lentiviral shRNA vectors that silence RPS19 expression in human CD34+ cells to induce a DBA phenotype.23
Two lentiviral vectors expressing shRNA (shRNA1 and shRNA2) targeting different regions of the human RPS19 mRNA sequence were used to induce the DBA pheno- type, and a vector expressing a scrambled shRNA sequence (Scr) was used as a healthy control. To ensure that the human construct in the vector would not be degraded by the targeting shRNA, alignments were per- formed and there were two mismatches (out of 19 nucleotides) for shRNA1 and four mismatches (out of 19 nucleotides) for shRNA2. Thus, it is very unlikely that the gene expression derived from the human codon-opti- mized RPS19 cDNA would be affected by either shRNA. Since the shRNA vectors also contain a GFP marker gene, transduced GFP+ cells were sorted for further examination.
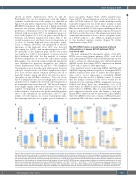
ABCD
EFGHI
Figure 4. Gene-corrected bone marrow cells show a competitive advantage in contributing to long-term hematopoiesis in vivo. (A, B) Vector copy number in periph- eral blood (A) and bone marrow (B). (C, D) Donor reconstitution in peripheral blood (C) and bone marrow (D). (E–I) The percentage of transduced cells in hematopoi- etic stem cells (E), megakaryocyte progenitors (F), pre-granulocyte-macrophage and granulocyte-macrophage progenitors (G), pre-megakaryocyte-erythroid (H), and pre-colony-forming unit erythroid and colony-forming unit erythroid (I) (n=13-16, error bars represent the standard deviation, black asterisks indicate the statistical significance of the comparison of recipient-derived cells between the mock and EFS-RPS19 groups, orange asterisks indicate the statistical significance of the com- parison of donor-derived cells between the mock and EFS-RPS19 groups. *P<0.05, **P<0.01, ***P<0.005, ****P<0.001 by one-way analysis of variance). VCN: vector copy number; PB: peripheral blood; BM: bone marrow; HSC: hematopoietic stem cells; MkP: megakaryocyte progenitors; pre-GM/GMP: pre-granulocyte macrophage and granulocyte macrophage progenitors; preMegE: pre-megakaryocyte-erythroid; preCFU-E/CFU-E: pre-colony-forming unit–erythroid (CFU-E)/CFU-E.
haematologica | 2022; 107(2)
451
