
Page 281 - 2022_01-Haematologica-web
P. 281
RINF maintenance of SMAD7 sustains human erythropoiesis
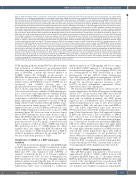
Figure 2. RINF knockdown leads to a reduction in total number of red blood cells generated from human hematopoietic stem and progenitor cells. (A) Schematic representation of the shRNA-mediated RINF loss of expression experiment. CD34+ cells isolated from cord-blood were transduced at day 5 of the amplification step with the lentiviral vector pTRIPDU3/GFP expressing a shRNA targeting RINF mRNA expression (shRNA/RINF) or a non-target sequence (shRNA/Control). GFP+ cells were sorted by fluorescent activated cell sorting 2 days after transduction. At that time, cell culture kinetics with less than 80% of CD36+ cells or more than 5% of cell death (trypan blue) were not pursued. Erythropoietin (EPO) was added after sorting and maintained for 17-18 days. (B) RINF knockdown efficiency was estimated at the mRNA level by quantitative reverse transcriptase polymerase chain reaction (qRT-PCR) at D0 of EPO (i.e., right after GFP-sorting). Here, the results are shown for one representative experiment out of seven independent experiments performed. A Student t-test was performed. (C) RINF knockdown efficiency was estimated at the protein level (specific band at 33 KDa) by western-blot analysis (see Methods). P85 (PIK3R1) was used as the loading control.42 In order to obtain enough pro- tein material, CD34+ cells were amplified from a pool of five cord-blood units (5 donors). For each lane, protein extracted from 3x10⁵ cells was loaded right after sort- ing, at D0 of EPO. Band intensities were quantified with Multigauge software and the relative expression of RINF protein (normalized to the loading control) is indi- cated above the image in percentages of the shControl condition (D) Cell viability was assessed by the trypan blue exclusion method at 2 or 3 days after GFP-sorting. The histogram represents the percentage of trypan blue negative cells. (E) Cell culture growth was monitored in six independent experiments (here, cord-blood donors). The proliferation curve, expressed in cumulative population doublings, is shown for one representative experiment (donor#6, left panel). For most experi- ments (or “donors”), CD34+ cells from several cord blood units (2-4) were pooled. Fold cell expansion (right panel) was calculated by dividing the absolute output number of expanded red blood cells after 17-18 days of culture with EPO by the respective number on day 0 (of treatment with EPO). An average reduction of ~45% was noted in the RINF knockdown condition (paired t-test, P=0.04, n=6). For two out of the six donors (donors 1 and 2, in gray), the shRNA-RINF#4-induced reduction in the total number of RBC was not obvious in our serum-free conditions (and absence of transforming growth factor b [TGFb]). These two unresponsive donors were also treated with TGFb, and data are presented in Figure 4E, F (F) Photographs of the five larger BFU-E colonies for the two conditions, here for one representative donor at day 11 (left panel). Two days after transduction (day 5 of expansion), GFP-expressing cells were sorted by flow cytometry and 500 cells per well were seeded into methycellulose containing cytokines (IL3, SCF, G-CSF, GM-CSF, and EPO) enabling the formation of erythroid colonies (BFU-E). BFU-E colonies were imaged between 11 and 14 days of culture numerated from three donors (n=103 and n=110, respectively). The size of each BFU-E colony was determined by imaging analy- sis using ImageJ/Fiji. On average, the colonies were smaller for the shRINF#4-transduced condition (unpaired two-tailed t-test, P<0.01). (G) CD34+ cells were isolated from bone marrow of healthy donors (n=4). Colony-forming cells (CFC) were counted between 11 and 14 days of culture. The histogram illustrates the mean number of small and large BFU-E-derived colonies. The error bars indicate donor-to-donor variability for each vector (± standard error of mean). To assess the effect of shRNA- mediated RINF silencing, a paired comparison was performed using the Fisher exact test.
TGFb signaling pathway during RINF knockdown-depen- dent acceleration of erythropoiesis, we performed liquid cell culture experiments of primary CD34+ cells in the pres- ence of SB431542, a potent and selective inhibitor of TGFbRI38 (Figure 4B). Strikingly, in the presence of SB431542, the maturation of RINF knockdown cells (evi- denced by a faster acquisition of erythroid cell surface markers such as CD49d/Band3 at day 10 of EPO) was not accelerated and SMAD2 protein was not phosphorylated/activated after 3 days of EPO (Figure 4C, lanes 5 and 6), supporting the efficiency of the inhibitor. Conversely, in the absence of inhibitor, RINF-silencing gave rise to a faster rate of phosphorylation of SMAD2 protein, here noted at 8 h of EPO (Figure 4C compare lanes 1 and 2, or the kinetics of pSMAD2 waves in both conditions, right panel), indicating a higher sensitivity to autocrine TGFb sig- naling, which would be mediated through SMAD2, as pre- viously reported in hematopoietic cells.35 A weaker RBC expansion was also noted for RINF knockdown cells, even when TGFb1 (5 ng/mL) was added as late as day 11 of EPO treatment (Figure 4D). Moreover, even for the two donors whose RINF silencing was more subtle (donors 1 and 2, Figure 2E), RINF knockdown cells were more sensitive than control cells to TGFb1 (Figure 4E, F). This was especially pronounced at low doses (0.1 ng/mL), at which we found faster acquisition of GPA (at day 6 of EPO) and reduced RBC production (at day 17 of EPO) (Figure 4F). Taken together, these data suggest that RINF knockdown cells were more sensitive to TGFb and that the level of RINF in erythroid progenitors influences the upcoming RBC pro- duction, at least in the presence of TGFb.
Identification of SMAD7 as a RINF target gene candidate
To identify molecular mechanisms by which RINF might modulate responsiveness to TGFb, we reanalyzed our pre- viously published gene expression microarray datasets of K562 and UT75.3 cells transduced with shRINF#4 or shControl.7 A relatively discrete set of 193 gene candidates (Online Supplementary Table S1) were downregulated by RINF knockdown in both cell lines. Strikingly, ingenuity pathway analyses revealed that this gene list was enriched in genes belonging to the TGFb signaling pathway (Online Supplementary Figure S4C). Considering its well-known
inhibitory function on TGFb-signaling and its low expres- sion in MDS, SMAD7 appeared as a promising candidate for functional investigation.33,34 Encouragingly, SMAD7 was also downregulated by RINF knockdown in a third hematopoietic cell line, MV4-11 (Online Supplementary Figure S4E, right panel) and the downregulation of SMAD7 was confirmed by qRT-PCR analyses in K562 cells, even though the knockdown appeared moderate (~45%, P<0.001) in these independent experiments (Online Supplementary Figure S4D, right panel).
We next measured RINF levels in two cell line models of erythroid maturation, the K562 cell line treated with hemin and the UT75.3 cell line treated with EPO39 after GM-CSF withdrawal (Online Supplementary Figure S4A, B). In agree- ment with our findings in primary cells, RINF protein expression was downregulated upon treatment-induced erythroid differentiation, as early as 10 h after treatment with hemin for K562 cells, and after 2 days with EPO for UT75.3 cells (Online Supplementary Figure S4A). Moreover, RINF knockdown accelerated the erythroid maturation pro- gram (Online Supplementary Figure S4B) triggered by hemin in K562 cells (noted after 1 day of treatment), or EPO in UT75.3 cells (at 4 days of treatment). We also investigated whether RINF overexpression could delay hemoglobiniza- tion. To this end, we used the retroviral system MigR/IRES- GFP vector1 (Online Supplementary Figure S5A, upper panel) to drive ectopic expression from full-length RINF cDNA. We found high constitutive expression of RINF protein for both cell lines (Online Supplementary Figure S5A), without cell toxicity or consequences on cell proliferation (not shown). When we evaluated erythroid differentiation using benzidine staining (Online Supplementary Figure S5B) we found that RINF overexpression reduced hemoglobiniza- tion in both cell lines (P<0.001), consistent with our knock- down experiments (Online Supplementary Figure S4A, B).
RINF controls SMAD7 transcription directly
Our qRT-PCR analyses demonstrated a robust increase (approximately 5-fold) of SMAD7 mRNA levels in cells overexpressing RINF (Figure 5A). To investigate whether RINF-mediated induction of SMAD7 mRNA was direct and occurred at the transcriptional level, we performed ChIP experiments with anti-RINF antibodies. To this end, five sets of primers were designed for regions encompassing the
haematologica | 2022; 107(1)
273
