
Page 258 - 2022_01-Haematologica-web
P. 258
A.O. Khan et al.
J
G
HI
KL
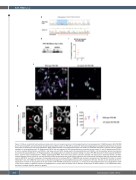
Figure 3. Mature, proplatelet forming induced pluripotent stem cell megacarycytes are both polyglutamylated and polyglycylated. TUBB1 knockout (KO) iPSC-MK do not form proplatelets and demonstrate disordered polymodified tubulin. (A) iPSC-MK co-stained for CD42 and polyglycylated or polyglutamylated tubulin show that these cells are positive for both polymodifications. Both polyglutamylated and polyglycylated tubulin are evident in proplatelet extensions, including nascent platelet swellings on the proplatelet shaft. (B) Neighboring CD42b- cells are negative for both polymodifications (indicated by red arrows). (C and D) Approximately 50-60% of cells in multiple differentiations are CD42b+, and these cells are 100% double positive for polymodification and CD42b+. (E) All proplatelet extensions observed are positive for polymodification. (F) Polyglutamylation and polyglycylation are evident by western blotting in mature iPSC-MK derived from three separate differenti- ations. (G) iPSC were transfected with a TUBB1 targeting guide RNA, after which indel positive cells were isolated and sequenced to positively identify a bi-allelic insertion-deletion mutant (clone T2). (H) This clone was further analyzed and loss of b1-tubulin expression was confirmed by quantitative real-time polymerase chain reaction (qRT-PCR). (I and J) A comparison of proplatelet production in wild-type (WT) vs. TUBB1 KO cells revealed a complete loss of proplatelet formation in mutant CD41/42b+ cells. (K) TUBB1 KO clones show a disordered arrangement of polymodified residues when compared to WT cells. KO cells do not demonstrate the re- organization of tubulin to the periphery of the cell evident in WT iPSC-MK (indicated by red arrows). (L) A measure of the polyglutamylation and polyglycylation in WT vs. KO clones reveals a significant increase in polyglycylation in mutant cells consistent with an aberrant accumulation of these residues. (n=3 independent differ- entiations, standard deviation plotted on graphs).
250
haematologica | 2022; 107(1)
