
Page 205 - 2022_01-Haematologica-web
P. 205
T-cell-receptor-activity shaped miR-omes of T-PLL
effects, which has to be addressed in future experiments. Deregulation of these hallmark miR in T-PLL was further associated with either a pronounced cellular activation phe- notype or more aggressive clinical presentations.
MiR-21 stood out as one of the most abundant miR in T- PLL. In contrast to the current concept of miR-21 being an onco miR,44 we detected significantly downregulated miR- 21 levels in T-PLL samples as compared to healthy donor T cells. Our integrative correlations further revealed an asso-
ciation of low miR-21 expression with more aggressive dis- ease presentations. We identified SKP2 and MAP3K1 as predicted targets of miR-21 in T-PLL, potentially mediating these features. Notably, we did not find significant negative correlations of miR-21 with those mRNA that were previ- ously described to mediate the effect of this miR as a potent suppressor of cell cycle inhibition and apoptosis.34 This indi- cates a T-cell specific and context-dependent function of miR-21.
AB
CD
E
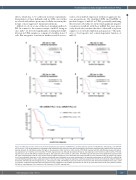
Figure 5. miR-based overall survival score for T-cell prolymphocytic leukemia (miROS-T-PLL) stratifies patients based on miR-200a-3p, miR-223-3p, and miR-424- 5p expression. (A to D) Associations of microRNA (miR) expression with overall survival (OS) from diagnosis (see Online Supplementary Table S12 for the compre- hensive dataset). (A) miR-98-3p (median OS high vs. low expression: 16.3 months vs. 29.4 months, P=0.0008, log-rank test); (B) miR-200a-3p (median OS high vs. low expression: 52.7 months vs. 19.1 months, P=0.001, log-rank test); (C) miR-223-3p (median OS high vs. low expression: 14.9 months vs. 26.0 months, P=0.001, log-rank test), and (D) miR-424-5p (median OS high vs. low expression: 14.4 months vs. 26 months, P=0.0007, log-rank test) were most significantly associated with OS, when comparing the tertile of T-PLL patients with the highest expression to the tertile with the lowest expression of the respective miR. (E) Analysis via training (n=22) and validation data sets (n=22): optimum thresholds were calculated by recursive partitioning for all possible combinations of miR-200a-3p, miR-223-3p, and miR-424-5p expression levels, adding one point to the total score if the respective expression cutoff was passed. Best results were obtained using the following thresholds: miR-200a-3b: fold change (fc)<2.21, miR-223-3p: fc ≥9.8, miR-424-5p: fc≥0.91 (fc relative to CD3+ pan-T cells derived from healthy donors) and a cutoff of ≥2 points. A significant OS association was observed in the validation set (P=0.0004, log-rank test) as well as (E) in the total cohort of 44 T-PLL patients (median OS high vs. low expression: 14.4 months vs. 29.4 months, P<0.0001, log-rank test).
haematologica | 2022; 107(1)
197
