
Page 203 - 2022_01-Haematologica-web
P. 203
T-cell-receptor-activity shaped miR-omes of T-PLL
AB
C
DE
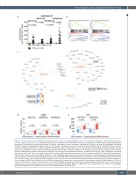
Figure 4. Increased expression of miR-200c and miR-141 clusters is associated with deregulation of cell cycle regulators reflected in more activated phenotypes and more aggressive disease course. (A) Differential expression of miR-141 and miR-200 family members as analyzed by small-RNA sequencing showed significant upregulation of miR-141-3p (fold change [fc]=43.2; P<0.0001), miR-141-5p (fc=29.0; P=0.0001), miR-200c-3p (fc=38.2; P<0.0001) and miR-200c-5p (fc=56.6; P=0.003, n=46 T-cell prolymphocytic leukemia [T-PLL], n=6 controls). (B) Exemplary gene set enrichment analysis (GSEA) plots of miR-200/-miR-141 correlated mRNA: E2F TARGETS: NES=3.64, q<0.0001, G2M CHECKPOINT: NES=3.05, q<0.0001 (both based on miR-141-3p correlated mRNA). (C) Predicted targets (by seed sequences, see Methods section for details) correlating negatively with miR-141/-miR-200 expression in all analyzed cases and controls showed regulatory networks involved in DNA damage response and prosurvival signaling. Font color represents differential expression of mRNA comparing T-PLL cells (n=48 cases) and healthy donor-derived CD3+ pan-T cells (n=6 donors; for description of global mRNA sequencing results refer to Online Supplementary Figure S5 and Online Supplementary Table S5, blue= lower expression; red= higher expression). Color of highlighting boxes represents assignment of genes to functional groups of DNA damage response pathways (black) and prosurvival signaling (grey). (D) Groups of low and high miR-141/-200 expression were assigned by results of small-RNA sequencing: after divi- sion into three tertiles, cases of the lower were compared to those of the upper tertile. Cases were evaluated for CD40L surface expression using flow cytometry. T- PLL with higher miR-141-5p, miR-200c-3p, and miR-200c-5p expression presented with a more activated T-cell phenotype (median CD40L expression: 16.5% vs. 0.05%, P=0.03; 16.5% vs. 0.05%, P=0.03, 20.0% vs. 0.0%, P=0.009; MWW). (E) Higher serum LDH levels (see Online Supplementary Table S9 for a summary of clin- ical data) were associated with high expression of miR-141-3p and miR-200c-3p (median 898 U/L vs. 509 U/L; P=0.03; median 917 G/L vs. 509 G/L; P=0.02; MWW). Groups were divided into three tertiles and the lower was compared against the upper tertile.
haematologica | 2022; 107(1)
195
