
Page 201 - 2022_01-Haematologica-web
P. 201
T-cell-receptor-activity shaped miR-omes of T-PLL
A
BC
D
E
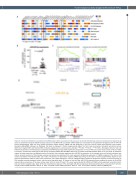
Figure 3. Functional affiliations of predicted microRNA-targets reflect associations with processes of altered DNA damage response and prosurvival signaling. (A) Gene set enrichment analysis (GSEA) heatmap based on microRNA (miR) associated mRNA. GSEA were conducted for all significantly deregulated miR (n=34 miR; Online Supplementary Table S1) using ranked correlation indices between mRNA and miR expression in 41 T-PLL and six healthy donor-derived T-cell samples. Exemplary HALLMARK pathways are displayed. Full figure is displayed in Online Supplementary Figure S8. Color code summarizes normalized enrichment scores (NES, blue=negative NES; red=positive NES). Statistical significance is summarized via asterisks (*P<0.05; **P<0.01 ; ***P<0.001 ; Kolmogorov-Smirnov-test). (B) Differential expression of miR-223-3p as analyzed by small-RNA sequencing shows significant upregulation in T-PLL (n=46) over normal T-cell controls (n=6); (fc=9.85; P=0.0002). (C) Exemplary GSEA plots of miR-223-3p correlated mRNA: P53 PATHWAY: NES=2.59, q<0.0001, G2M CHECKPOINT: NES=-2.34, q=0.003). (D) Predicted targets (by seed sequences, see Methods section for details) that correlated negatively with miR-223-3p expression in all analyzed cases and controls represent reg- ulatory networks involved in DNA damage response and prosurvival signaling. Font color represents differential expression of mRNA comparing T-PLL cells (n=48 cases) and healthy donor-derived CD3+ pan-T cells (n=6 donors; for description of global mRNA sequencing results refer to Online Supplementary Figure S5 and Online Supplementary Table S5, blue= lower expression; red= higher expression). Color of highlighted boxes represents assignment of genes to functional groups of DNA damage response pathways (black) and prosurvival signaling (grey). (E) Groups of low and high miR-233-3p expression were assigned by results of small-RNA sequencing via comparison of the lower versus upper tertile of cases. Primary T-PLL cases were evaluated for CD38 and CD69 surface expression using flow cytom- etry (see Online Supplementary Table S8 for the comprehensive dataset). T-PLL with high miR-223-3p expression levels presented with a more activated T-cell phe- notype (median CD38 expression: 65.5% vs. 3.6%, P=0.006; median CD69 expression: 8.5% vs. 1.0%, P=0.1; Mann–Whitney–Wilcoxon [MWW] test).
haematologica | 2022; 107(1)
193
