
Page 155 - 2022_01-Haematologica-web
P. 155
Oncogenic microRNA in T prolymphocytic leukemia
AB
C
DE
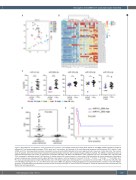
Figure 2. MicroRNA are deregulated in T-cell prolymphocytic leukemia. (A) Principal component analysis (PCA) based on microRNA (miRNA) expression profiles of indicated 21 T-cell prolymphocytic leukemia (T-PLL) cases and T cell fractions. (B) Heatmap of 35 most differential expressed miRNA between CD4+ effector T cells (CD4E) and T-PLL. Heatmap shows the robust normalized z-scores of each miRNA indicated by the color legend and set to maximum 2 (dark red color). The columns show 25 samples, which are hierarchically clustered using their Euclidean distances with complete linkage and Ward’s method. The miRNA are ordered top-down by increased false discovery rate values. (C) Expression of miR-141, miR-200c, miR-181a and miR-181b in T-PLL subgroups (all T-PLL, CD4+CD8– T-PLL and CD4+CD8+ T-PLL) compared to indicated normal T-cell fractions. E: effector subset; M: memory subset; N: naïve subset. Data was tested for normal distribution. Significance between the groups was calculated with the Mann-Whitney-U test (black) or with the Student’s t-test (red) *P<0.05, **P<0.01, ***P<0.001, ****P<0.0001. (D) T- PLL cases were grouped based on high miR-200c/141 and or miR-181a/b expression (fold-change [FC] >2 compared to normal CD4E, n=16) and low miR-200c/141 and miR-181a/b expression (FC <2, n=5). White blood cell counts (WBC) are displayed. Statistical significance was determined with a Student’s t-test with Welch’s correction. (E) Kaplan Meier plot showing cumulative survival of patients with high vs. low miR-200c/141 expression. Statistical significance was calculated with the Mantel Cox test (log-rank test).
haematologica | 2022; 107(1)
147
