
Page 154 - 2022_01-Haematologica-web
P. 154
S.J. Erkeland et al.
A
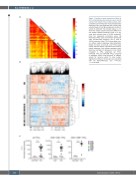
Figure 1. Analysis of gene expression profiles of 23 T-cell prolymphocytic leukemia cases and 18 normal T-cell subsets from healthy controls. (A) A correlation plot showing that T-cell prolymphocytic leukemia (T-PLL) are separated from normal T-cell subsets based on their gene expression profiles. A subset of probesets that showed signal, i.e., for which the median absolute deviation (MAD) from the median exceeds threshold T=0.6 on a log2 scale were selected (total of 3,261 probesets). Color bar represents correlation score. (B) Heatmap of T-PLL cases and normal T-cell subsets after unsupervised clustering (T=0.7; total of 1,904 probesets). Most T-PLL cases tightly clus- ter, without evident subgroups being detectable. Except for cases 21 and 24, most T-PLL cases cluster, without obvious correlation with immuno- logical subgroups. Color reflects expression level: blue=low, red=high. (C) Expression of the TCL1A oncogene in T-PLL subgroups (all T-PLL, CD4+CD8– T-PLL and CD4+CD8+ T-PLL) compared to indicated normal T-cell fractions. E: effector subset; M: memory subset; N: naïve subset. Significance between the groups was calculated with the Mann-Whitney-U test **P<0.01,
B ****P<0.0001.
C
146
haematologica | 2022; 107(1)
