
Page 124 - 2022_01-Haematologica-web
P. 124
V.L. Tzounakas et al.
A
B
C
F
DE
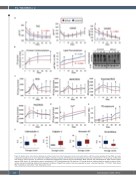
Figure 2. Redox status and calcium signaling of red blood cells from beta thalassemia minor and control donors. (A) Time course variation of total (TAC), uric acid- independent (UAiAC) and uric acid- dependent (UAdAC) antioxidant capacity. (B) Membrane lipid peroxidation and protein carbonylation (n=8 per group; 4.1R protein was used for internal control). (C) Variation of endogenous/exogenously induced (tert-butyl-hyperoxide; tBHP, diamide and phenylhydrazine; PHZ) reactive oxygen species (ROS) levels. (D) Intracellular calcium accumulation. (E) Phosphatidylserine (PS) exposure. (F) Storage levels of selected proteins related to calcium home- ostasis and lipid remodeling. Dashed lines represent trendlines of logarithmic models. Data are presented as mean ± standard deviation. *P<0.05; F: fresh blood; TBA: thiobarbituric acid; bThal+: beta thalassemia minor.
116
haematologica | 2022; 107(1)
