
Page 122 - 2022_01-Haematologica-web
P. 122
V.L. Tzounakas et al.
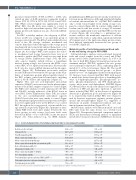
puscular volume [MCV] =0.965, for HbA2 = 1,000), who carried an array of b-Hb mutations commonly found in Greece (IVS I-1, IVS I-6, IVS I-110, IVS II-1 and IVS II- 745). While osmotic fragility was significantly lower in bThal+ RBC, free Hb levels were similar to control. A trend for high total antioxidant capacity (TAC) and low plasma protein carbonylation was also observed in bThal+ (Table 1).
For RBC storability analysis, the subgroup of bThal+ donors (n=18) was compared to an equivalent group of average controls (n=20). The bThal+ units exhibited lower levels of free Hb (storage, oxidative, mechanical and osmotic hemolysis) either throughout the storage period (mechanically and osmotically induced hemolysis) or for the last 2 weeks of it (storage and oxidative hemolysis) (Figure 1A). According to ROC curve analysis, the osmot- ic, mechanical and storage hemolysis have very good potential to predict the bThal+ status at every time point of storage (Online Supplementary Figure S1A). Of note, only osmotic fragility (which follows a logarithmic increase during storage) was lower in the bThal+ versus control RBC in vivo. Apart from hemolysis, the extracellu- lar K+ was also lower in bThal+ plasma and day 42-super- natant (Figure 1B). Preliminary proteomics analysis revealed differences between the two groups in the abun- dance of membrane proteins physiologically related to the RBC volume control/cation homeostasis, including piezo-1, Na+/K+ ATPase and aquaporin-1 (Figure 1C).
Higher TAC and uric acid-dependent antioxidant capacities (UAdAC) were measured in the plasma/super- natant of the bThal+ samples compared to control (Figure 2A). ROC curve analysis revealed variations in both TAC and UAdAC, strongly indicative of the bThal+ status in stored RBC (Online Supplementary Figure S1B), in contrast to the uric acid-independent antioxidant capacity (UAiAC) levels that were very similar to control (Figure 2A). Membrane lipid peroxidation and protein carbonyla- tion were significantly lower in the bThal+ versus control RBC throughout the storage period or from middle stor- age onwards, respectively (Figure 2B). Spontaneous intra- cellular ROS levels were quite similar between the two donor groups at early storage, but lower levels were detected in bThal+ versus control RBC in the late period (Figure 2C). Stress-induced (e.g., by tBHP, diamide,
phenylhydrazine) ROS generation basically resulted in no between-group differences. Although significantly higher at baseline, the intracellular Ca2+ of bThal+ RBC exhibited only a trend toward higher levels during storage com- pared to controls (Figure 2D). In contrast, while similar at baseline (and for the first weeks of storage), PS external- ization was significantly lower in bThal+ RBC for the last 2 weeks (Figure 2E). According to a preliminary pro- teomics analysis, the membrane expression of calcium related proteins (such as calmodulin, calpain and annexin A7/synexin) and of the lipid remodeling protein scram- blase differed significantly between the two groups of stored RBC (Figure 2F).
Metabolic profile of beta thalassemia red blood cells in vivo and during storage in CPD-SAGM
Full metabolomics analyses were performed in paired fresh and stored samples from the control and bThal+ groups (n=15, Online Supplementary Figures S2 to S11). In the case of fresh RBC (Figure 3A) partial least square-dis- criminant analysis (PLS-DA) separated the two groups across principal component 1 (PC1), explaining approxi- mately 11% of the total variance (Figure 3B). The top 25 metabolic changes between the two groups – as deter- mined by t-test – are highlighted in the heat map in Figure 3C. Increases were observed in bThal+ RBC with respect to metabolites derived from glycolysis or branching path- ways (2,3-diphosphoglycerate, phosphoglycerate iso- mers, phosphoenolpyruvate) and PPP (6-phosphoglu- conate, ribose mono and diphosphate, NADPH) (Figure 3C). Overall, these steady state analyses are suggestive of activation of PPP and glycolysis upstream to pyruvate kinase in fresh bThal+ RBC, in the absence of significant alterations of glutathione pools and turn-over (Figure 4A to C, respectively). Indeed, bThal+ RBC were character- ized by decreases in pyruvate, arginine, creatine, glycine, inosine and monophosphate (Figure 3C), suggestive of alterations in purine deamination/oxidation and argi- nine/polyamine metabolism (Figure 4D to E).
Metabolomics analyses were thus performed on stored RBC units from the same donors on a weekly basis (Figure 3D). Unsupervised principal component analysis (PCA) and hierarchical clustering analysis of significant metabolites by repeated measures ANOVA are shown in
Table 1. Selected characteristics of beta thalassemia blood minor in vivo compared to control. Control (n=186)
bThal+ (n=18) 5.88 ± 0.34*
39.84 ± 2.20$ 13.36 ± 0.71* 67.07 ± 6.72* 22.51 ± 2.42* 32.69 ± 0.67$ 13.64 ± 0.88 9.24 ± 2.17$ 0.389 ± 0.028* 2.73 ± 1.24 735 ± 142$ 0.296 ± 0.111$ 6.78 ± 0.56$
Red blood cells (x106/mL)
Hematocrit (%)
Total Hemoglobin (g/dL)
Mean corpuscular volume (fL)
Mean corpuscular hemoglobin (pg)
Mean corpuscular hemoglobin concentration (g/dL) Red cell distribution width (%)
Mean platelet volume (fL)
Mean corpuscular fragility (% [NaCl])
Free hemoglobin (mg/dL)
Total antioxidant capacity of plasma (TAC) (mM Fe2+) Carbonylated proteins of plasma (nmol/mg)
Total plasma proteins (g/dL)
4.94 ± 0.33 44.07 ± 2.58 15.00 ± 1.07 89.38 ± 4.17 30.44 ± 2.08 34.00 ± 1.09 12.48 ± 0.57 7.47 ± 1.57 0.438 ± 0.025 3.61 ± 1.83 622 ± 94.2 0.350 ± 0.107
7.19 ± 0.46
Data are presented as mean ± standard deviation. *P<0.05; ($) marginal significance. bThal+: beta thalassemia minor.
114
haematologica | 2022; 107(1)
