
Page 103 - 2022_01-Haematologica-web
P. 103
Early epigenetic changes in KM3-AML
F
G
Figure 3. Epigenetic analysis changes in KMT2A-MLLT3 acute myeloid leukemia. (A) Venn diagram of peaks determined by MACS2 in different stages of the model system (CD34+, CD34+KM3, KM3 AML model) for H3K4Me3 and H3K79Me2 (n=3 for chromatin immumoprecipitation [ChIP]-sequencing of each mark). (B) A scat- terplot of ChIP-sequencing enrichments for each histone mark in an area ± 2,000 bp (H3K4me3) or -1,000 to +3000 bp (H3K79me2) around the transcription start site for each gene is shown, with individual genes colored by the log ratio (CD34+/CD34+KM3) of expression for each gene. (C) Boxplots show the expression of CCR1
2
and its ligands in different stages of the model leukemias and in pediatric KMT2A-AML patients. The dotted green line represents an arbitrary threshold for an
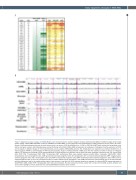
expressed gene (FPKM >1) (D) Annotation of ATAC-sequencing peaks unique to model leukemias (mAML) show that the majority are either in intronic or intergenic regions. (E) Hierarchical clustering of ATAC-sequencing peaks in published data from different normal blood cell types compared to leukemic cells. NK: natural killer cells; CD4T: CD4+ T lymphocytes; CD8T: CD8+ T lymphocytes; ERY: erythrocytes; AML: acute myeloid leukemia (model); Mono: monocytes; CD34 HSPC: CD34+ hematopoietic stem and progenitor cells; GMP: granulocyte-monocyte progenitor cells; B: B lymphocytes; CLP: common lymphoid progenitor; MEP: megakaryocyte- erythroid progenitor cells; HSC: hematopoietic stem cells; MPP: multipotential progenitor cells; LMPP: lymphoid-primed multipotent progenitors cells; CMP: common myeloid progenitor cells. (F) A list of transcription factors is shown ranked by their abundance in the mAML and with their corresponding rank in the entire dataset and their expression level in the model system stages in the columns to the right. (G) UCSC snapshot showing an example of a gene with ATAC-sequencing peaks in CD34+KM3, mAML, CD34+ HSPC, hematopoietic stem cells and monocytes. The blue vertical line shows a peak that is unique to the mAML samples, whereas red vertical lines highlight common peaks that also overlap ENCODE transcription factor clusters.
haematologica | 2022; 107(1)
95
