
Page 101 - 2022_01-Haematologica-web
P. 101
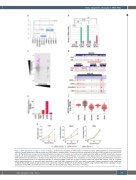
Early epigenetic changes in KM3-AML
AB
CD
EF
G
Figure 2. DNA methylation changes in model leukemias. (A) Hierarchical clustering of differentially methylated cytosines (DMC) identified by methyl-sequencing analysis of model leukemias at different stages and KM3 patients’ samples (pAML). Numbers and arrows represent the number of DMC relative to the initial CD34+ cells. (B) The KM3 fusion induces a strong hypomethylation phenotype in both patient and model acute myeloid leukemias (pAML and mAML, respectively), whereas model B-cell acute lymphoblastic leukemias (mB-ALL) predominately exhibit hypermethylation. (C) As noted in other global studies, the overall correlation between DNA methylation and expression is relatively limited, likely due in part to the complexity of the localization and size of the changes. (D) Differentially methylated regions around genes known to be suppressed (GATA2) or activated (HOXA9) in AML can be seen comparing CD34+ cells versus AML patients’ cells. (E, F) ADCY9 exhibits hypomethylation in its promoter region specifically in the model AML, compared to CD34+ cells, which is correlated with gene expression levels, specifically in KMT2A-MLLT3 AML models as well as patients (E) and external data from TARGET (F). (G) Knockdown of ADCY9 using multiple shRNA shows a significant impact specifically on KM3-AML cell proliferation but not on AML cells lacking the fusion (KG1a; *P<0.005, **P<0.001).
haematologica | 2022; 107(1)
93
