
Page 65 - 2021_12-Haematologica-web
P. 65
A centralized NGS diagnostic platform for AML
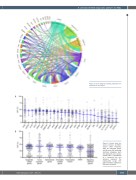
Figure 2. Circos diagram showing mutation con- currences in our cohort.
A
B
Figure 3. Variant allele fre- quency analysis. (A) Mean variant allele frequency (VAF) for individual genes and (B) mean VAF according functional categories. Each dot represents one variant, median VAF is represented by a horizontal bar and whiskers represent the interquartile range. ITD: internal tandem duplication; PM: point mutations.
haematologica | 2021; 106(12)
3085
