
Page 62 - 2021_12-Haematologica-web
P. 62
C. Sargas et al.
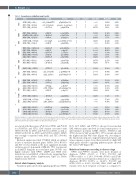
Table 2. Second cross-validation round results.
ID
1
2
3
4
5
6
Gene
NPM1 (NM_002520) FLT3 (NM_004119.2)
FLT3 (NM_004119.2) PHF6 (NM_032458.2)
DNMT3A (NM_022552) NRAS (NM_002524.4)
RUNX1 (NM_001754.4) IDH1 (NM_005896.3)
TET2 (NM_001127208.2) PHF6 (NM_032458.2) EZH2 (NM_004456.4) SRSF2 (NM_003016.4) JAK2 (NM_004972.3)
FLT3 (NM_004119.2) FLT3 (NM_004119.2)
SH2B3 (NM_005475.2) PHF6 (NM_032458.2)
EZH2 (NM_004456.4) NRAS (NM_002524.4)
EZH2 (NM_004456.4) ASXL1 (NM_015338.5)
ASXL1 (NM_015338.5) TP53 (NM_000546.5)
SF3B1 (NM_012433.3) RUNX1 (NM_001754.4)
ASXL1 (NM_015338.5) ASXL1 (NM_015338.5)
SF3B1 (NM_012433.3) CSF3R (NM_156039.3) CSF3R (NM_156039.3)
Coding
c.863_864insCCTG
c.1801_1802ins30 c.2505T>A
c.548C>T c.2264T>C c.34G>A
c.1306dupT c.394C>T
c.3866G>T c.346C>T c.2255G>C c.161C>T c.1849G>T
c.2028C>G c.2504A>C
c.557G>T
c.129_130insGG c.2212_2231del
c.35G>A c.796G>A
c.1772dup c.1745_1758del c.916C>T
c.1873C>T
c.593A>G c.2463_2478del
c.2537G>A c.2098A>G c.1853C>T c.2346dup
Protein Detected Included
p.Trp288Cysfs*12 7 7
p.Asp600_Leu601ins10 7 7 p.Asp835Glu 5 7
p.Ser183Phe 4 6 p.Phe755Ser 7 7 p.Gly12Ser 4 7
p.Ser436Phefs*164 6 7 p.Arg132Cys 7 7
p.Cys1289Phe 7 7 p.Arg116* 4 5 p.*752Ser 7 7
p.Ser54Phe 6 7 p.Val617Phe 6 7
p.Asn676Lys 5 7 p.Asp835Ala 6 7
p.Ser186Ile 2 3
p.Lys44Glyfs*38 4 5 p.Ala738Argfs*18 6 7
p.Gly12Asp 7 7 p.Gly266Arg 4 7
p.Tyr591* 7 7 p.Pro582Argfs*32 6 7 p.Arg306* 6 7
p.Arg625Cys 6 7
p.Asp198Gly 7 7 p.Asp821Glufs*12 7 7
p.Ser846Asn 7 7 p.Lys700Glu 6 7 p.Thr618Ile 6 7
p.Ser783Glnfs*6 3 7
Error Rate
0.00%
0.00% 28.57%
33.33% 0.00% 42.86%
14.29% 0.00%
0.00% 20.00% 0.00% 14.29% 14.29%
28.57% 14.29%
33.33%
20.00% 14.29%
0.00% 42.86%
0.00% 14.29% 14.29%
14.29%
0.00% 0.00%
0.00% 14.29% 14.29% 57.14%
Mean VAF
34.88%
29.62% 2.46%
50.32% 42.10% 1.75%
43.24% 16.25%
43.02% 42.25% 10.39% 5.73% 2.73%
22.17% 5.40%
56.40%
49.44% 29.49%
17.08% 4.86%
21.69% 13.96% 4.49%
8.02%
77.98% 40.47%
54.70% 47.47% 47.06% 37.77%
SD
8.47%
9.32% 0.53%
2.23% 5.85% 0.30%
4.33% 2.31%
6.82% 1.90% 1.59% 0.66% 0.66%
3.63% 0.62%
0.57%
3.48% 6.96%
2.33% 0.93%
2.32% 2.87% 0.28%
1.06%
2.75% 8.29%
6.82% 1.85% 1.50% 2.92%
Detected: number of centers which have detected the mutation; Included: number of centers which include each variant in its next-generation sequencing assay; Error Rate: number of centers which failed to detect the variant regarding the total of centers;VAF: variant allele frequency; SD: standard deviation of VAF establishment among centers; CRV: clinically-relevant variants; NCRV: non-clinically relevant variants.
associated with these genes (P<0.01 for NPM1 and P<0.05 for DNMT3A and FLT3). IDH variants associated with NPM1 (P=0.01 for IDH1 and P<0.01 for IDH2) as well as DNMT3A (P<0.01 for IDH1 and P<0.05 for IDH2). SRSF2 was strongly co-mutated with IDH2 and TET2 (P<0.01) (Figure 2).
Exclusion analysis provided 17 MEGS which are defined as lists of exclusive mutated genes. NPM1, TP53, RUNX1 and KIT set was defined as the most significant mutually exclusive gen set (p-nominal: 2,25E-24). TP53 was present in all MEGS being the most exclusive gene. RUNX1 was highly exclusive with NPM1. CEBPA and NRAS were included in several MEGS of three blocks suggesting their exclusive nature (Online Supplementary Figure S3; Online Supplementary Table S3).
Variant allele frequency analysis
Variants in genes involved in signaling pathways (NRAS,
FLT3, KIT, KRAS, and PTPN11) showed lower median VAF, whereas genes involved in clonal hematopoiesis of indeterminate potential (CHIP) (ASXL1, DNMT3A and TET2) showed a VAF around 50%. TP53 variants showed the highest median VAF value (Figure 3A). According to the functional categories, epigenetically related genes and tumor suppressor genes were characterized by a high VAF while genes related to signaling pathways genes showed the lowest VAF (Figure 3B).
Mutational landscape according to disease stage
NPM1 and PTPN11 variants were more frequent at diagnosis (NPM1 23.16% vs. 9.76%, P=0.004, and PTPN11 6.62% vs. 1.10%, P=0.048). RUNX1 and SF3B1 variants were more frequent in refractory as compared to diagnosis (RUNX1 30.49% vs. 16.43%, P=0.003 and SF3B1 9.76% vs. 4.23%, P=0.049). IDH1, IDH2 and WT1 variants were more frequent at relapse as compared to
3082
haematologica | 2021; 106(12)
NCRV CRV NCRV CRV NCRV CRV NCRV CRV NCRV CRV NCRV CRV
