
Page 61 - 2021_12-Haematologica-web
P. 61
A centralized NGS diagnostic platform for AML
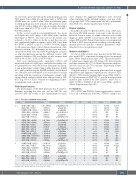
we observed a great diversity in the included genes in each NGS panel. Some AML relevant genes such as NPM1 and CEBPA were not studied, while other non-relevant genes for AML pathogenesis were included. The global error rate was 39.02% with a higher error rate in variants showing a VAF lower than 10% (77.04 ± 6.98% vs. 18.56 ± 29.24%, P<0.001) (Table 1).
In the second round (post-standardization), the mean read depth was 4,032 (range, 1,463-4,532) with a median uniformity of 98.34%. The error rate for all variants was reduced to 14.43% (Table 2). In this round, the error rate was significantly higher in variants with a VAF lower than 5% (28.57 ± 14.28% vs. 12.27 ± 14.39%, P=0.031) (Figure 1). All centers provided a correct clinical classification of the detected variants. No differences in the error rate were observed between indels and SNV. Regarding the accuracy of VAF determination among the different centers, VAF standard deviation (SD) was higher in indel variants than SNV (5.44 ± 2.80 vs. 2.15 ± 2.03, P=0.001).
After cross-validation results, uniformity (>85%) and mean read depth of 1,000X were established as quality con- trol parameters for a valid NGS assay. Synonymous, intron- ic and polymorphic variants (minor allele frequency [MAF] ≥1% and/or included in the dbSNP database) were filtered out. VAF ≥5% was established as a cutoff value for variant reporting with the exception of pathogenic variants with strong clinical evidence which were reported with a VAF ≥1% (e.g, TP53 or FLT3). Variants accomplishing all these requirements were considered.
Platform performance
The performance of the NGS platforms (Ion Torrent vs. Illumina) regarding the error rate and the VAF SD was assessed after the results of the standardization rounds
Table 1. First cross-validation round results.
ID Gene Coding Protein
were obtained. No significant differences were observed when analyzing all the included variants or in any of the sub groups (Indel, SNV, variants with VAF ≤5% and variants with VAF >5%) (Online Supplementary Table S2).
Clinical validation
From October 2017 to October 2019 a total of 823 sam- ples from 751 AML patients were sent to the laboratory network. Disease status at sample collection was: newly diagnosis (DX) (n=639), refractoriness (RS) (n=82), and relapse (RP) (n=102). Patient characteristics are summarized in Table 3. NGS was performed according to already imple- mented protocols and the consensus parameters estab- lished in both cross-validation rounds.
Mutation distribution
A total of 2,052 variants were reported in the 823 sam- ples, with 90.81% of patients showing at least one mutated gene (Online Supplementary Figure S1A). The mean number of variants per sample was 2.49 (range, 0-8). Most patients had three variants (24.37%), followed by patients with two (21.04%) and one (20.77%) variants, respectively (Online Supplementary Figure S1B).
A high frequency of variants in genes involved in signal transduction and epigenetic regulation was observed. FLT3 (24.06%: FLT3 internal tandem duplications [ITD] 16.52%, FLT3-point mutations [PM] 8.87%) was the most prevalent mutated gene followed by IDH (22.60%: IDH1 9.11%, IDH2 13.85%), DNMT3A (21.63%) and NPM1 (21.51%) (Online Supplementary Figure S2).
Co-mutations
FLT3, NPM1 and DNMT3A were significantly co-mutat- ed for all combinations (P<0.001). PTPN11 variants also
1 NPM1 (NM_002520) IDH2 (NM_002168.3)
DNMT3A (NM_022552) STAG2 (NM_001042749.2) RUNX1 (NM_001754.4) ASXL1 (NM_015338.5)
2 CEBPA (NM_004364.4) CEBPA (NM_004364.4)
IDH2 (NM_002168.3) NRAS (NM_002524.4) EZH2 (NM_004456.4) EZH2 (NM_004456.4) DNMT3A (NM_022552) KMT2A (NM_001197104.1) GATA2 (NM_032638.4) ASXL1 (NM_015338.5)
3 DNMT3A (NM_022552) TP53 (NM_000546.5)
STAG2 (NM_001042749.2) CUX1 (NM_181552.4) ASXL1 (NM_015338.5)
4 TP53 (NM_000546.5) EZH2 (NM_004456.4) ASXL1 (NM_015338.5)
c.860_863dup c.419G>A c.2645G>A c.2124del c.736A>C c.1934dup
c.68_78del c.895A>G c.419G>A c.37G>C c.952del c.1321G>A c.1961G>A c.3253G>A c.1084C>T c.1934dup
c.2678G>C c.652_670del c.2858G>A c.1588A>C c.1934dup
c.392A>T c.553G>C c.1934dup
p.Trp288Cysfs*12 p.Arg140Gln p.Arg882His p.Leu708Phefs*9 p.Thr246Pro p.Gly646Trpfs*12
p.Pro23Glnfs*81 p.Ser299Gly p.Arg140Gln p.Gly13Arg p.Thr318Glnfs*3 p.Glu441Lys p.Gly654Asp p.Val1085Met p.Arg362* p.Gly646Trpfs*12
p.Trp893Ser p.Val218fs p.Arg953Gln p.Lys530Gln p.Gly646Trpfs*12
p.Asn131Ile p.Asp185His p.Gly646Trpfs*12
Detected Included
5 5 6 6 6 6 1 3 1 6 1 6
4 5 5 5 6 6 6 6 3 4 4 4 1 6 1 4 1 5 2 6
6 6 5 6 1 3 1 3 1 6
6 6 1 4 1 6
Error Rate
0.00% 0.00% 0.00% 66.67% 83.33% 83.33%
20.00% 0.00% 0.00% 0.00% 25.00% 0.00% 83.33% 75.00% 80.00% 66.67%
0.00% 16.67% 66.67% 66.67% 83.33%
0.00% 75.00% 83.33%
Mean VAF
41.68% 44.73% 43.77% NA
NA NA
51.32% 45.32% 49.82% 46.32% 47.54% 50.13% NA
NA
NA 39.82%
44.54% 67.58% NA NA NA
47.33% NA NA
SD
18.90% 3.31% 1.92% NA NA NA
7.17% 3.86% 5.22% 2.01% 2.16% 2.81% NA NA NA 4.41%
2.32% 19.42% NA NA NA
1.83% NA NA
Detected: number of centers which have detected the mutation; Included: number of centers which include each variant in its next-generation sequencing assay; Error Rate: number of centers which failed to detect the variant regarding the total of centers;VAF: variant allele frequency; SD: standard deviation of VAF establishment among centers; NA: not applicable; variants only were detected by one center.
haematologica | 2021; 106(12)
3081
