
Page 184 - 2021_12-Haematologica-web
P. 184
Letters to the Editor
ing 100 ng/mL interleukin 6 (IL-6), 10 ng/mL IL-3 and 50 ng/mL SCF in Iscove’s Modified Dulbecco’s medium sup- plemented with 15% BIT 9500. Cells were then transduced with green fluorescent protein (GFP) lentiviruses expressing scramble short hairpin RNA (shRNA) or shRNA directed against SARS2 (knockdown efficiency of 70%). Forty-eight hours later, GFP positive cells were sorted and cultured with the differentiation medium containing 10 ng/mL IL-3, 50 ng/mL SCF and 2 U/mL of EPO to undergo terminal ery- throid differentiation.
SARS2 depletion in erythroid progenitors resulted in drastic decrease of cell proliferation (Figure 2A) and delayed erythroid differentiation (Figure 2B). In addition, an increased apoptotic rate was observed in SARS2-depleted cells (Figure 2C). As SARS2 is involved in mitochondrial protein synthesis, we wanted to evaluate whether
A
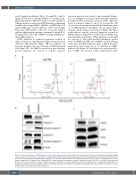
increased apoptosis was related to mitochondrial dysfunc- tion. Accordingly, we measured mitochondrial membrane potential by flow cytometry and assessed the expression levels of activated caspases 3 and 9 by western blot. We observed a profound mitochondrial depolarization in a sub- set of SARS2-depleted cells (Figure 3A) associated with a cleavage of both caspase 3 and caspase 9 (Figure 3B). Those results indicate that the increased apoptosis reported in SARS2-depleted erythroblasts resulted at least partly, from mitochondrial perturbations. While mutations in mt-aaRS are expected to affect mitochondrial translation system, levels of COXII and ATP8, two mtDNA-encoded subunits of the mitochondrial respiratory chain complex IV and V respectively were found not to be affected in SARS2- depleted cells (Figure 3C). In addition, no excessive produc- tion of ROS was detected (Online Supplementary Figure
B
C
Figure 3. Increased apoptosis in SARS2-depleted cells is mitochondria-mediated. (A) At day 4 of the second phase of culture, mitochondrial membrane potential was assessed by flow cytometry in scramble short hairpin RNA (shCTRL) and shSARS2-transduced cells after staining with the potentiometric DilC1(5) fluores- cent dye. The percentage of depolarizing cells, defined as the Dilc1(5)low population was then assessed by flow cytometry. Data are representative of 2 inde- pendent experiments. (B) Western blot showing SARS2, cleaved caspase 3 and cleaved caspase 9 expression levels in shCTRL- and shSARS2-transduced cell at day 4 of the second phase of culture. Proteins levels were compared to b-actin expression. Data are representative of 2 independent experiments. (C) Representative western blot showing SARS2, COXII and ATP8 expression levels in shCTRL- and shSARS2-transduced cells at day 4 of the second phase of culture. Proteins levels were compared to b-actin expression.
3204
haematologica | 2021; 106(12)
