
Page 159 - 2021_12-Haematologica-web
P. 159
CCR1 drives dissemination of multiple myeloma plasma cells
human MM cell line OPM2 (Online Supplementary Figure S1). Loss of CCR1 protein expression in OPM2-CCR1- KO-1 and OPM2-CCR1-KO-2 cell lines was confirmed by flow cytometry (Figure 4A). Furthermore, migration towards rhCCL3 was not observed in the OPM2-CCR1- KO cell lines, confirming loss of CCR1 function (Figure 4B). Proliferation of OPM2 cell lines was unaffected by
CCR1 KO, either basally (Figure 4C and D) or following addition of rhCCL3 (Figure 4E).
In order to determine if CCR1 KO limited MM PC dis- semination in vivo, NSG mice were injected with either OPM2-EV-1 or OPM2-CCR1-KO-1 cells. KO of CCR1 reduced primary tumor burden by 45.5%, compared with controls (Figure 5A). Circulating tumor cell numbers were
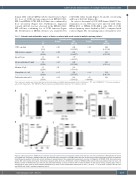
Table 1. Univariate and multivariable analysis of factors associated with overall survival in multiple myeloma patients.1
Univariate analysis n P-value2
Multivariable analysis
(%)
CCR1 > median 71 (50%)
High-risk gene signature4 38 (26.8%)
Age ≥65 years 36 (25.4%)
b2-microglobulin ≥5.5 mg/L 33 (23.2%)
Albumin <35 g/L 31 (21.8%)
Hemoglobin <100 g/L 40 (28.2%)
Proliferative index ≥10% 20 (14.1%)
HR3 (95% CI)
HR3 (95% CI)
2.48 (1.05-5.86)
0.026 0.044 0.62 0.021 0.54 0.001 0.018
2.46 (1.11-5.45)
2.16 (1.02-4.57)
0.77 (0.32-1.97)
2.45 (1.15-5.24)
1.31 (0.56-3.08)
3.52 (1.67-7.45)
2.69 (1.18-6.12)
1.36 (0.56-3.27)
P-value2 0.039
0.50 --
0.60 1.26 (0.53-3.00)
--
0.009 3.18 (1.34-7.56)
0.61 1.29 (0.48-3.44)
1Gene expression analysis and clinical data from n=142 newly diagnosed multiple myeloma patients in the total therapy 3 (TT3) trial (E-TABM-1138);28 2Cox proportional haz- ardsmodels;3Hazardratio(HR);4MS,MForPRgene-expressionprofiling-definedsubgroups;48 CI:confidenceinterval.
ABC
D
E
Figure 2. CCR1 expression in 5TGM1 murine multipe myeloma cell line increases migration towards CCL3 but does not affect proliferation. (A) Expression of murine Ccr1 mRNA was confirmed in 5TGM1-CCR1 cells. (B) CCR1-HA protein expression in 5TGM1-CCR1 cells was confirmed by immunoprecipitation using an anti-HA anti- body followed by western blotting with anti-HA antibody. A representative of two independent experiments is shown. (C) Migration of 5TGM1-CCR1 and empty vector control (EV) cells towards 100 ng/mL rhCCL3 was assessed after 24 hours. (D) Relative number of 5TGM1-CCR1 and -EV cells was assessed over 72 hours. (E) Relative number of 5TGM1-CCR1 and -EV cells was assessed following 72 hours of culture with or without addition of 100 ng/mL rhCCL3. Graphs depict mean ± standard error of the mean of three biological replicates (A) or three or more independent experiments (C to E). **P<0.01, ****P<0.0001, unpaired t-test (A), two- way ANOVA with Sidak’s multiple comparison test (C).
haematologica | 2021; 106(12)
3179
