
Page 158 - 2021_12-Haematologica-web
P. 158
M.N. Zeissig et al.
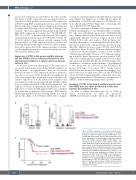
factors were taken into account (Table 1). In order to further investigate if CCR1 expression was associated with poor outcomes for MM patients, we assessed CCR1 expression in BM PC using RNA-sequencing data from a cohort of MM patients who had a sample taken at diagnosis (baseline) and a sample taken following at least one line of therapy (sub- sequent). These data suggested that patients with relatively high CCR1 expression at baseline (n=7; P<0.05, HR=4.3, 95% CI: 1.0-18.1) or patients with elevated CCR1 expres- sion following treatment (n=10; P=0.080, HR=3.0, 95% CI: 0.9-10.4) tended to have inferior survival compared with patients with low CCR1 expression both at baseline and following therapy (n=26; Figure 1 B and C). Taken together, these data suggest that CCR1 expression either at baseline or following treatment may be associated with poorer over- all survival for MM patients.
Expression of CCR1 in the mouse multiple myeloma cell line 5TGM1 does not affect proliferation in vitro and increases incidence of splenic and bone dissemi- nation in vivo
As we have previously shown that CCR1 expression is associated with increased circulating MM PC numbers in MM patients,17 we hypothesized that the association between increased CCR1 expression and poor prognosis was due to a role for CCR1 in MM PC dissemination. In order to investigate this, we initially assessed whether con- stitutive expression of CCR1 affected the migration and dissemination of the mouse MM cell line 5TGM1, which does not express detectable CCR1 basally (Figure 2A), and exhibits low levels of spontaneous dissemination in vivo.29 Expression of functional HA-tagged CCR1 was confirmed by quantitative polymerase chain reaction (PCR) and by immunoprecipitation/western blotting (Figure 2A and B) and by the ability of the 5TGM1-CCR1 cells to migrate
AB
towards recombinant human CCL3 (rhCCL3) in a transwell assay (Figure 2C). Expression of CCR1 did not affect the proliferation of 5TGM1 cells, relative to 5TGM1-EV con- trols, either basally (P=0.63; Figure 2D) or following addi- tion of rhCCL3 (P=0.99; Figure 2E).
In order to investigate whether CCR1 expression affects 5TGM1 dissemination in vivo, 5TGM1-CCR1 or 5TGM1- EV cells were intratibially injected into C57BL/KaLwRij mice. Primary tumor burden in the injected tibiae was not significantly different between animals injected with 5TGM1-CCR1 cells and controls (P=0.82; Figure 3A). Similarly, the numbers of circulating MM cells in the PB, or the tumor burden in the contralateral leg, were also not sig- nificantly different between groups (P=0.62 and P=0.41, respectively; Figure 3B and C). However, there was a signif- icant increase in the incidence of tumor in the 5TGM1- CCR1 group, with eight of 11 mice (73%) in this group hav- ing detectable green fluorescence protein positive (GFP+) cells in the contralateral leg, compared with four of 11 mice (36%) injected with 5TGM1-EV cells (P<0.0001; Figure 3D). Furthermore, an increase in the incidence of dissemination to the spleen was also observed in the 5TGM1-CCR1 group, with nine of 11 mice (82%) having tumors detectable in the spleen by bioluminescence imaging, com- pared with four of eight mice (50%) in the 5TGM1-EV cohort (P<0.0001; Figure 3E and F). Collectively, these data suggest that expression of CCR1 increases dissemination of MM PC, without affecting primary tumor growth.
Knockout of CCR1 in the human multiple myeloma cell line OPM2 does not affect proliferation in vitro and prevents dissemination in vivo
In order to further investigate the role of CCR1 in tumor dissemination in MM, we generated CRISPR/Cas9-mediated CCR1 knockouts (KO) in the
C
Figure 1. CCR1 is expression is elevated in multiple myelo- ma patients and is associated with poor prognosis. (A) CCR1 expression (ΔMFI) on CD38++/CD138+/CD45lo/CD19- bone marrow (BM) plasma cells (PC) from newly diagnosed mono- clonal gammopathy of undetermined significance (MGUS) (n=7) and multiple myeloma (MM) (n=28) patients was assessed by flow cytometry. Graph depicts median with interquartile range, showing all data points. (B) CCR1 expres- sion is shown for CD138-selected BM MM PC from patients with a sample taken at diagnosis (baseline) and a sample taken following at least one line of therapy with bortezomib (subsequent) (CoMMpass RNA-sequencing dataset, n=43 patients). Patients were categorized as having low tumor expression of CCR1 (CCR1 <10 FPKM at both baseline and subsequent biopsy; n=26), high CCR1 (CCR1 ≥10 FPKM at baseline; n=7) or increased CCR1 (baseline CCR1 <10 FPKM and subsequent CCR1 ≥10 FPKM; n=10). (C) Kaplan-Meier plots of overall survival are shown for MM patients stratified based on BM MM PC expression of CCR1 at baseline and subsequent to therapy.
3178
haematologica | 2021; 106(12)
