
Page 91 - 2021_10-Haematologica-web
P. 91
BLUEPRINT hematopoietic transcriptomes atlas
AB
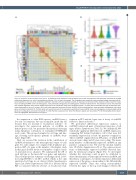
Figure 4. Properties of the identified novel genes. (A) Heatmap of the Spearman rank correlation (rho) matrix computed from the expression estimates of the 368 novel genes expressed (i.e., with a log expression estimate >0) in at least one sample. The dendrogram was computed using complete-linkage clustering with dis- tance specified as one minus the correlation coefficient. (B) Violin plots and overlaid box plots of sequence conservation (UCSC phastCons 100) values for known long non-coding (lnc)RNA, novel non-coding genes, novel potentially coding genes and coding genes annotated in Ensembl 75. The phastCons scores were obtained from multiple alignment of the human (hg19) sequences to the sequences of 99 other vertebrate species. (C) Violin plots and overlaid box plots of expression esti- mates (expressed as log2(m+1), where μ is the real scale expression estimate) of known lncRNA, novel non-coding genes, novel potentially coding genes and coding genes annotated in Ensembl 75. (D) Violin plots and overlaid box plots of the expression specificity of known lncRNA, novel non-coding genes, novel potentially coding genes and coding genes annotated in Ensembl 75. (B-D) Pairwise comparisons for which the Wilcoxon signed-rank test yielded P<0.05 following Bonferroni adjust- ment are highlighted. Abbreviations as in Figure 1
C
D
In comparison to other RNA species, circRNA have a low rate of formation, but can accumulate inside the cell because they are resistant to exonuclease activity.50 To investigate the expression patterns of circRNA in hematopoietic cells, we performed hierarchical clustering using Spearman correlations of normalized PTESFinder read counts. This grouped samples by cell type and line- age, showing tissue-specific patterns of circRNA abun- dance (Figure 5B).
Next, we assessed the variation in the contribution of circRNA abundance to the transcriptional output of each gene. For each sample, we computed the abundance pro- portion (AP) of a gene as the number of backsplice reads in that gene divided by the total number of spliced reads of any kind across all genes. We summarized the AP of each cell type as the mean AP over genes and replicates. This cell type-specific summary of AP ranged from 1.02% in resting HUVEC to 12.45% in PLT, which is the only anucleated cell type in our dataset (Online Supplementary Figure S4A, Online Supplementary Table S10). Elevated AP in PLT is consistent with the absence of steady-state tran-
scription in PLT and the lower rate of decay of circRNA relative to linear molecules.51
We performed differential expression analysis of circRNA between all pairs of functional categories of cell types (Online Supplementary Table S2). We identified 5,993 statistically significant differences in circRNA expression, comprising 929 distinct backsplices (<2%) that were dif- ferentially expressed in at least one pairwise comparison. These circRNA originated from 698 genes, of which 678 were protein-coding and 20 were non-coding. The maxi- mum number of differentially expressed circRNA in any pairwise comparison was 372 and the median number was 15 (Online Supplementary File 4). The expression pat- terns of differentially expressed circRNA clustered sam- ples by functional category (Figure 5C). To investigate whether the clustering could, in part, be attributed to shared mechanisms of transcription between circRNA and their linear counterparts, we inferred pairwise differential expression of the genes corresponding to the differentially expressed circRNA. There was strong correspondence between the signs of the log fold changes between the
haematologica | 2021; 106(10)
2619
