
Page 89 - 2021_10-Haematologica-web
P. 89
BLUEPRINT hematopoietic transcriptomes atlas
reflecting the primary functions corresponding to all cell type categories (Online Supplementary Table S2) except BAS, M0 and MONO, at a family-wise error rate <5% (Online Supplementary Table S7). Figure 3C illustrates the results of the enrichment analysis for the MK/PLT and DC categories.
Differential expression of microRNA
We applied the same differential expression modeling described above to the small RNA data for which biologi- cal replicates were available (MK, NEU, MONO, M1, M2 and CD4TC samples). Of 2,588 miRBase-annotated26 miRNA, 603 had a posterior probability of differential expression >0.8, of which 573 were classified as cell type- specific. The mean expression of miRNA was strongly associated with having at least one validated target among the 29,920 validated miRNA-messenger RNA (mRNA) interactions in the mirecords, mirtarbase and tarbase data- bases27 (P<2 x 10-16, effect size = 0.16, logistic regression). For example, 46 of the 50 miRNA (92%) having the great- est mean expression had at least one validated target, while only 458 (18.2%) of the remaining 2,508 miRNA had a validated target. The miRNA with the greatest expression in their assigned cell type (Online Supplementary Table S8) have been previously linked to relevant cellular functions in that cell type. For example, hsa-miR-21-5p (the most highly expressed M1-specific miRNA) is involved in resolution of wound inflammation28 and macrophage polarization;9 hsa-let-7g-5p, hsa-miR-26a-5p, hsa-miR-150-5p and hsa-miR-146b-5p (the most highly expressed CD4TC-specific miRNA) are important modu- lators of CD4+ T cells;30,31 and hsa-miR-126-3p (the most highly expressed MK-specific miRNA) plays a role in MK/PLT biogenesis.32,33 However, using the existing data- bases of miRNA-mRNA interactions, we did not find any correlation between the expression of miRNA and the expression of their targets, which is consistent with miRNA being only one of a diverse set of molecular play- ers in transcriptional regulation of hematopoietic cells and is in agreement with the results of other studies showing
that miRNA induce translational repression without mRNA destabilization.34
De novo transcriptome assembly identifies novel long non-coding RNA
Several studies have shown that almost two-thirds of the genome is pervasively transcribed,35 mostly because of the transcription of various types of unannotated non-cod- ing RNA (ncRNA).36 Among the ncRNA, lncRNA com- prise a heterogeneous class of single or multi-exon RNA genes, with crucial roles in controlling gene expression during developmental and differentiation processes.37 The proportion of RNA species encoded in a genome which are of the lncRNA type increases with developmental complexity, hinting at the importance of RNA-based con- trol mechanisms in the evolution of multicellular organ- isms.38 To identify novel transcripts, we assembled sam- ple-specific transcriptomes from read alignments to the reference genome using guided transcriptome assembly,39 which we then merged into a consensus transcriptome. To avoid the assembly of artefactual sequences originating from pseudogenes, we used a conservative approach that filtered out intronless transcripts and transcripts intersect- ing any of the transcripts present in Ensembl 75, GEN- CODE 19 or RefSeq40 (Online Supplementary File 3). This unified filtered transcriptome contained 645 multi-exonic transcripts originating from 400 novel genes. Using the expression values of the subset of 368 novel genes having a log expression >0 in at least one sample, we were able to cluster the samples by cell type (Figure 4A), suggesting that these novel genes might play a role either in the deter- mination of cellular identity or in performing cell type- specific functions.
The vast majority (348 out of 400) of the novel multi- exonic genes had a coding potential below the standard CPAT20 threshold (0.364) used to discriminate potentially coding genes from non-coding genes. However, the 52 potentially coding genes had other characteristics suggest- ing that they were also non-coding. Firstly, the proportion of their nucleotides overlapping transposon-associated
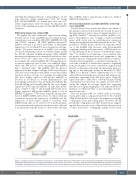
AB
Figure 2. Complexity of genes and miRNA transcriptomes. (A) Cumulative distribution of the fraction of total transcription contributed by non-mitochondrial protein- coding genes when sorted from most to least expressed in each cell type. The x axis is on the log10 scale. (B) Cumulative distribution of the fraction of small RNA transcription contributed by mature miRNA when sorted from most to least expressed in each cell type. The x axis is on the log10 scale. Abbreviations as in Figure 1.
haematologica | 2021; 106(10)
2617
