
Page 43 - 2021_10-Haematologica-web
P. 43
Targeting PKC and BET induces differentiation of AML
of CD11b expression was similar to that with H4 alone, suggesting that quiescent cells can also be differentiated by H4 (Figure 2E). Finally, to further evaluate the effect on leukemia stem cell function, AML-3 cells were treated for 4
days in vitro and transplanted into irradiated NRGS mice (DMSO control, 34,200 cells per mouse vs. H4-treated, 18,800 cells per mouse, 97% viability in both groups). Ten weeks after transplantation, the control mice had to be
ABC
DE
FG
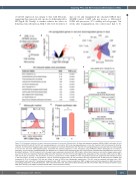
Figure 3. H4 treatment activates the gene expression program of monocytic differentiation. (A) Gene set expression analysis (GSEA) of AML-3 cells after 16 h of treatment with H4 10 mM. (B) The 100 most upregulated genes in red and the 100 most downregulated genes in blue after treatment with H4 compared to dimethyl- sulfoxide. (C) H4 treatment triggered a gene expression program of monocytic differentiation with the 100 most upregulated genes associated with monocytic lineage in red and the 100 most downregulated genes associated with myeloid progenitors in blue. Visualized using CellRadar software (developed by G. Karlsson’s Laboratory, Lund University; unpublished data from Dhapola et al.) based on gene expression data from normal human hematopoiesis (HemaExplorer) found at the BloodSpot database.24 (D) H4 treatment led to changes in gene expression associated with MYC targets, inflammatory response, and reactive oxygen species path- way. (E) The three most significant Hallmark GSEA plots after treatment with H4. (F) H4 10 mM triggered the upregulation of the monocytic CD64 marker in AML-3 cells after 4 days of treatment. The data shown are mean ± standard error of mean (SEM) from three independent experiments designated with individual symbols in the lower graph (*P<0.05, ns not significant, using an unpaired two-tailed t-test). (G) The translation rate was increased by H4 10 mM treatment of AML-3 cells (measured at 19 h of treatment). The data are shown as mean ± SEM of two independent experiments (*P<0.05, using an unpaired two-tailed t-test). HSC: hematopoietic stem cells; HPC: hematopoietic progenitor cells; CMP: common myeloid progenitors; MEP: megakaryocyte-erythroid progenitors; GMP: granulocyte- macrophage progenitors; ProM: promyelocytes; mDC: myeloid dendritic cells; pDC: plasmacytoid dendritic cells; NK: natural killer; NES: normalized enrichment score; FDR: false discovery rate; DMSO: dimethylsulfoxide; MFI: mean fluorescent intensity.
haematologica | 2021; 106(10)
2571
