
Page 182 - 2021_10-Haematologica-web
P. 182
S. El Hoss et al.
cell subtypes were identified based on morphological parameters of nuclear and cytoplasmic areas22 (Online Supplementary Figure S2B; Online Supplementary Table S1) that discriminate between the basophilic, polychromatic and orthochromatic erythroblasts (Figure 3D; Online Supplementary Figure S2C and D). HSP70 N/C ratio was sig- nificantly higher in SCD F than non-F-cells (Figure 3E) which was not the case for control cells (Online Supplementary Figure S2E), indicating that increased HSP70 cytoplasmic entrapment is a feature of SCD non-F-cells. Although there was no significant difference of HSP70 N/C ratio between SCD F-cells and control, this ratio showed a
AB
broader distribution in SCD F-cells (Online Supplementary Figure S2E). We hypothesized that this heterogeneity might be linked to the variable intracellular levels of HbF in these cells. Using an analysis mask that quantifies the amount of HbF per cell, we classified F-cells as either low or high F-expressing cells, depending on the intracellular expression level of HbF (Figure 3F). We found that HSP70 N/C ratio was higher in high F-cells compared to low F- cells (Figure 3G), implying that the amounts of HSP70 trapped in the cytoplasm were inversely related to the cytoplasmic content of HbF and suggesting that high amounts of HbF protect SCD erythroblasts against apopto-
CD
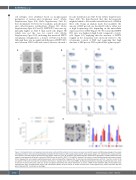
Figure 1. Cell proliferation and apoptosis during terminal erythroid differentiation in vitro under normoxia and partial hypoxia. (A) Microscopy images of two sickle cell disease (SCD) in vitro cultured erythroblasts incubated for 30 minutes at 20% (upper panel) and 5% (lower panel) oxygen. “N” represents the nucleus and the arrow points to the HbS polymers formed under 5% oxygen; scale bar: 5 mm. (B) A contour plot representing the distribution of glycophorin A (GPA)-positive cells with respect to the expression of Band 3 (x-axis) and CD49d (y-axis) at day (D) 3, D5, D7, D9 and D11 of phase II of culture in control erythroid precursors under normoxia (CN) or hypoxia (CH), and in patient erythroid precursors under normoxia (PN) or hypoxia (PH). (C) Cell count of erythroid precursors at D3, 5, 7 and 9 in control (n=4) and patient (n=6) under normoxia (N) and hypoxia (H) (means ± standard error of the mean [SEM]). (D) May Grunwald-Giemsa staining of erythroid precursors at D9 of phase II of culture (left panel; scale bar: 10 mm) and graph representing the cellular distribution as means ± SEM of early basophilic (EB), late basophilic (LB), polychromatic (Poly), orthochromatic (Ortho) and reticulocytes (Retics) at D9 of culture of control normoxia (CN), control hypoxia (CH), patient normoxia (PN) and patient hypoxia (PH). (continued on next page)
2710
haematologica | 2021; 106(10)
